
Top 10 Global Gold Producers
The last three years has been very good for the top 10 gold producers, with the average gold price rising from $1,268 per ounce (oz) in 2017 to $1,770/oz in 2020, whereas their costs stayed relatively stable.
The gold price reached its new all-time highs in August 2020 and has since retreated a bit. The question now is, will the gold price stabilize, retreat, or increase in 2021?
Log in to view GOLD shares
on EasyEquities USD


What does the high gold price mean for the top 10 producers? At what price do investors need to be concerned about profitability? Below are the top 10 gold producers for 2020 and 2019, with Sibanye Stillwater (SSW) added in the 11th spot for good measure (Figure 1). Note that Sibanye is more of a Platinum Group Metals (PGM’s) producer these days, but still produces a fair amount of gold.
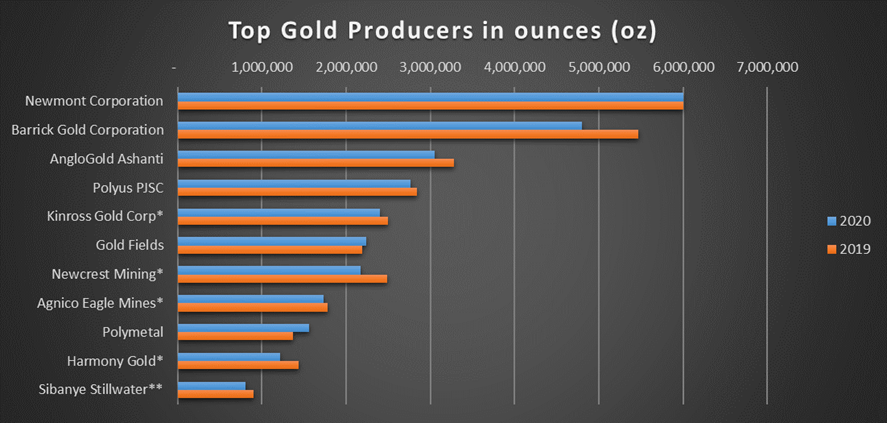
Figure 1: Top 10 Gold Producers globally, ranked according to their annual gold production in ounces for 2019 and 2020.
As seen in Figure 1, there is a very big difference in the production numbers from the top producer (Newmont) compared to the 10th producer (Harmony). This makes comparisons a bit tricky, even though they are all ranked in the top 10.
Cost Curve of the Top 10 Gold Producers
To assist with this comparison analysis frequently use some form of a cost curve (Figure 2). The level of detail on the cost curve depends on the investor constructing it. The main purpose is to compare the producers on a cost per ounce (or cost per tonne) basis, so that the investor can get a real sense of the company’s margins.
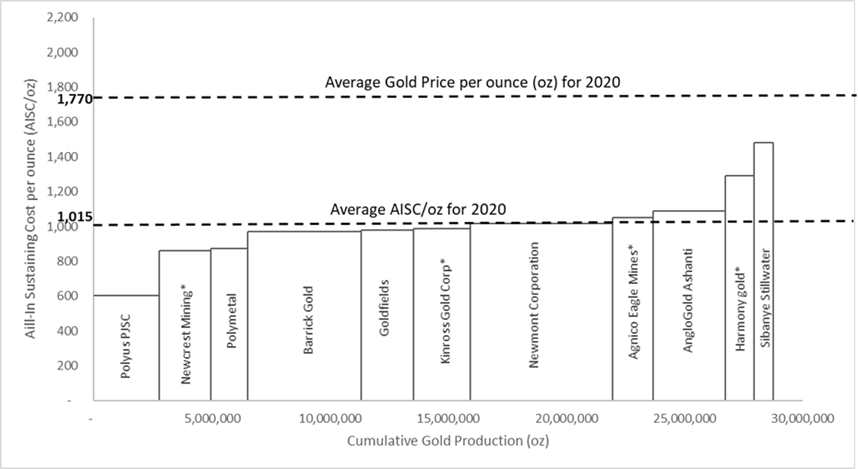
Figure 2: All in sustaining cost (AISC) vs Average gold price in US$/oz for the Top 10 Gold producers globally, including Sibanye Stillwater’s gold operations.
The cost curve illustrated in Figure 2 is based on the estimated annual production (horizonal axis) and all-in sustaining cost per ounce (AISC/oz on vertical axis) reported by the companies.
In other words, the width of the bar on the horizontal axis represents the annual production for that company (the wider the bar the more it produced). The height of the bars on the other hand represents the cost to produce an ounce of gold.
The South African producers such as Sibanye and Harmony has the highest cost per ounce compared to Polyus and Newcrest in Russia and Australia, with the lowest AISC/oz. As a rule of thumb and due to the principle of economies of scale, the wider and lower bars would generally be concentrated on the left of an industry cost curve whereas the thinner and higher bars would generally be concentrated on the right of an industry cost curve.
From an investment perspective, it is usually a good idea to look at companies in the lowest quartile of an industry cost curve (companies on the left). This does not mean that one can forget about the other financial ratios and tools commonly used to evaluate a company.
- Lowest cost producers: Polyus PJSC and Newcrest Mining in Russia and Australia
- Highest cost producers: Sibanye and Harmony in RSA
- Average AISC: $1,015/oz
- Average AISC margin (difference between gold price and AISC): $755/oz
Log in to view GOLD shares
on EasyEquities ZAR


Outlook
The profits for the gold producers from 2020 are expected to go through the roof. Most of them have already said as much in their recent press releases. What will happen in 2021, however? The key is to look at both the gold price and company cost. There are varying views on the gold price outlook for 2021, with some analyst suggesting $3,000/oz and others suggesting around $1,600/oz.
Without anyone really knowing what the gold price will do over the next year, it makes even more sense to look at the cost curve comparison. From the cost curve it is quite clear that all the gold producers listed above will still be smiling at an average gold price of $1,600/oz. It is only below $1,500/oz that one would expect to see some gold producers to lose money, but not all of them. Note that a 10% increase in gold price does not necessarily mean a 10% increase in the share price, it could be higher. The opposite is also true for a decline in gold price. The cost curve can also be used to compare producers of other commodities, such as the PGM producers for example. Sibanye would be a better fit in that cost curve, based on the amount of PGM’s it produces and its costs to produce them.
New to investing
and want to learn more about Barrick Gold (GOLD)?
Read: Undervalued Gold, Barrick Gold that is!

Sources:
*Final results for 2020 already released to market, whereas the rest are based on production guidance’s stated in recent press releases. Majority of the results for 2020 are expected to be released on the 18th of February 2021. **Sibanye Stillwater is added to the list for comparison purposes and might not be the actual 11th biggest gold producer in the world. 1All the data was extracted from public information available for these companies.2 https://www.statista.com/statistics/268027/change-in-gold-price-since-1990/ 3https://www.mining.com/web/goldman-proclaims-the-dawn-of-a-new-commodity-supercycle/
Take note that all stock data was taken after the markets closed on 12 February 2021.
Innes Buurman
EasyVestor, Project Geologist

The contents of this blog post are for information purposes only. This is the genuine opinion and actual experience of the user sharing their story and is not financial advice. The user doesn’t have any financial interest or relationship to us other than being a client. Any opinions, news, research, reports, analyses, prices, or other information contained within this research is provided by Innes Buurman a Project Geologist with experience in hard rock geology, over a range of commodities including Ni-Cu-PGE, Au, Zn-Pb, Coal, and CBM as general market commentary, and does not constitute investment advice for the purposes of the Financial Advisory and Intermediary Services Act, 2002. First World Trader (Pty) Ltd t/a EasyEquities (“EasyEquities”) does not warrant the correctness, accuracy, timeliness, reliability or completeness of any information (i) contained within this research and (ii) received from third party data providers. You must rely solely upon your own judgment in all aspects of your investment and/or trading decisions and all investments and/or trades are made at your own risk. EasyEquities (including any of their employees) will not accept any liability for any direct or indirect loss or damage, including without limitation, any loss of profit, which may arise directly or indirectly from use of or reliance on the market commentary. The content contained within is subject to change at any time without notice.
.