

ETF ANALYSIS
Performance review
SA property has been the best-performing asset over the past decade, thanks largely to the low interest rate regime since the 2008/09 financial crisis.
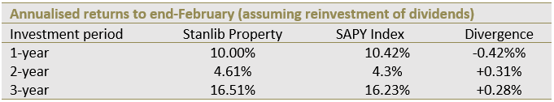
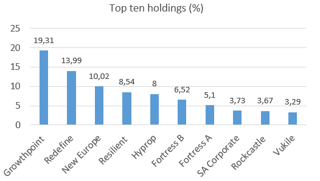
The South African Listed Property Index (JSE SAPY) returned 14.8% a year over that period, ahead of the JSE top 40 index and the all bond index, which had total returns of 9.65% and 7.6% respectively. This stellar performance, however, appears to be moderating. Over the past 12 months the SAPY returned 10.42%, trailing the all bond index which gained 12.91%. The Stanlib Property fund gained 10% in the 12 months to end-February following single-digit growth in the share prices of its key investments, Growthpoint and Redefine Income Fund. Its third-largest investment, New Europe, tanked 22% during the period.
Outlook
SA’s listed property sector has been on a rollercoaster ride in 2016 with increased political uncertainty, jitters over the possible downgrade of SA’s sovereign credit rating, the Brexit vote and the US interest rate dynamics affecting investment markets.
The future performance of sector will depend on a variety of factors. Investors look at growth drivers such as rental demand, vacancies, funding costs and the value of each property to determine what the shares are worth. Acquisitions or developments often drive up prices.
A quick valuation measure to look at when analysing property ETFs is the sector dividend yield – the annual dividend divided by the stock’s share price. Dividend yield can be viewed as the “interest rate” earned on an investment. Listed property is predominantly bought for the dividends and hence investors normally compare its yield with those of other income-generating asset classes such as cash, bonds or shares, but particularly bonds. Currently the SAPY is sporting a 6.02% dividend yield while the government’s 10-year bond (R186) is yielding 8.4%.
Fundamentals for local property companies are largely in good shape, with the poor economic outlook their main threat. If distributions grow roughly in line with inflation and you have a long investment horizon, attractive real returns are achievable even in a rising interest rate environment.
Suitability
Stanlib Property fund is an aggressively managed, high-risk portfolio which suits long-term investors with stomach for some capital volatility in the short term

What it does: The Stanlib SA Property ETF tracks the FTSE/JSE South African Listed Property Index (JSE SAPY) by holding constituent securities in the same weightings as they have in the underlying index. It provides returns linked to the performance of the SAPY in terms of both price performance and income.
Attractions
Property ETFs allow investors to enjoy returns from SA’s top listed commercial real estate without the hassles of the actual day-to-day management of the underlying properties. South African listed property has offered an attractive yield and strong capital appreciation over the past few years. Another attraction is the potential for high dividend yields.
Drawback
Unlike most ETFs which usually invest in a diversified pool of assets or stocks, the Satrix Property fund invests solely in property stocks. With no diversification, it is vulnerable to downturns in the property market.
Fees
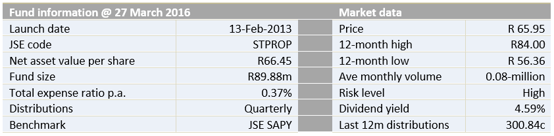
Total expenses take 0.37% from the fund each year.

Alternatives
Retail investors seeking exposure to property stocks have four other options: CoreShares PropTrax Ten, CoreShares PropTrax SAPY and CoreShares S&P Global Property (all managed by Grindrod Asset Management) and the recently lunched Satrix Property ETF.
Stanlib SA Property ETF and CoreShares PropTrax SAPY track the JSE SAPY index in a similar fashion. The Satrix Property ETF tracks the S&P SA Composite Property Capped Index which is a market cap-weighted index containing all companies in the S&P South Africa Composite Index that are classified as property companies. Investors can also get property exposure through the CoreShares PropTrax Ten. This ETF differs from the other three in that it tracks the FTSE/JSE SAPY Top 10 equal index. It holds the top 10 companies in SAPY in equal weightings of 10% each. While it won’t be as diversified as the other two it certainly caps investments in Growthpoint and Redefine. Also, by investing only in the top 10 property companies, its underlying index is likely to be more liquid. The CoreShares S&P Global Property ETF tracks the price and yield performance of the 40 largest stocks (by float-adjusted market capitalisation) of the S&P Global Property Index. Just like Satrix Property, it caps constituents at 10%.
Benefits of ETFs
- Gain instant exposure to various underlying shares or bonds in one transaction
- They diversify risk because a single ETF holds various shares
- They are cost-effective
- They are liquid – it is usually easy to find a buyer or seller and they trade just like shares
- High transparency through daily published index constituents
|