ETF ANALYSIS
Performance review
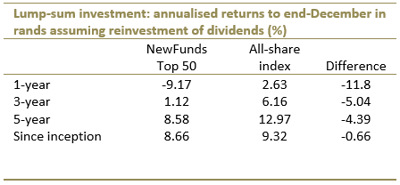
This ETF follows smart beta construction criteria, using alternative index construction rules instead of the typical cap-weighted index strategy. It takes into account factors such as size, value and volatility – and its 2016 performance is quite telling. It performed significantly poorer than the all share index over the past five years. NewFunds compares the fund’s performance with the all share index and although this contravenes the principles of benchmark tracking, it shows how smart beta can significantly diverge from a pure indexing strategy.
In the year to end-December the fund lost 9.25% compared with a 2.63% gain on the overall market.

Outlook: This fund constitutes blue-chip stocks with international operations and multi-currency income streams. So the value of the fund is driven by economic developments both locally and abroad, including exchange rate movements.
While most economic growth forecasts for this year are around 1%, there are some promising signs. The inflation outlook appears favourable, which bodes well for consumer demand. This is augmented by a good 2016/17 rain season; stable and improving commodity prices; a strengthening rand; and a softening global interest rate path. Furthermore, growth in other countries – where some of the fund’s constituent companies operate – is better than in SA, although the rand’s recent strength is likely to neutralise translated foreign earnings.
Additionally, investors should note that although equities are one of the most volatile asset classes, this fund is constructed to minimise volatility.
Key facts:
Suitability
The fund is ideal for investors with a medium- to long-term investment horizon and can be used as part of a core investment portfolio. Equity investments tend to exhibit higher short-term volatility than other asset classes, so a longer investment horizon gives a portfolio time for returns to overcome volatility and accumulate gains.
What it does
Since its inception until June 2015, this ETF tracked the eRAFI Overall SA Index which was made up of the top 40 SA companies ranked by fundamental valuation metrics. After the eRAFI was discontinued, the fund started tracking the S&P GIVI SA Top 50, which represents the top 50 stocks from the S&P GIVI (Global Intrinsic Value Index) SA composite index of general equities. The smart beta approach it uses selects stocks assessed to have the highest intrinsic value and lowest volatility, subject to certain liquidity constraints. The intrinsic value of each stock is determined by its book value and its discounted projected earnings.

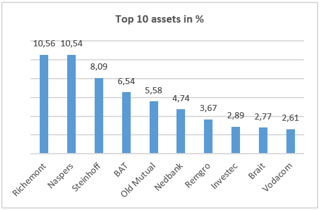
 Top holdings: The top 10 holdings of this ETF make up 58% of the fund. The fund is dominated by financials and consumer goods and services
Risk: Although the stock and sector diversity in the portfolio reduce the investment risk over the medium to long term, the ETF is still based on securities with inherent trading risks. The value of the investments will therefore rise and fall as markets fluctuate. Your capital is not protected.


Alternatives
The CoreShares Top 50 ETF, launched in 2015, tracks the same index as NewFunds S&P GIVI Top 50 so it also follows a smart beta approach. However, CoreShares Top 50 has a higher total expense ratio of 0.32%.

Benefits of ETFs
- Gain instant exposure to various underlying shares or bonds in one transaction
- They diversify risk because a single ETF holds various shares
- They are cost-effective
- They are liquid – it is usually easy to find a buyer or seller and they trade just like shares
- High transparency through daily published index constituents
|
Disclaimer
This research report was issued by Intellidex (Pty) Ltd. Intellidex aims to deliver impartial and objective assessments of securities, companies or other subjects. This document is issued for information purposes only and is not an offer to purchase or sell investments or related financial instruments. Individuals should undertake their own analysis and/or seek professional advice based on their specific needs before purchasing or selling investments. The information contained in this report is based on sources that Intellidex believes to be reliable, but Intellidex makes no representations or warranties regarding the completeness, accuracy or reliability of any information, facts, estimates, forecasts or opinions contained in this document. The information, opinions, estimates, assumptions, target prices and forecasts could change at any time without prior notice. Intellidex is under no obligation to inform any recipient of this document of any such changes. Intellidex, its directors, officers, staff, agents or associates shall have no liability for any loss or damage of any nature arising from the use of this document.
Remuneration
The opinions or recommendations contained in this report represent the true views of the analyst(s) responsible for preparing the report. The analyst’s remuneration is not affected by the opinions or recommendations contained in this report, although his/her remuneration may be affected by the overall quality of their research, feedback from clients and the financial performance of Intellidex (Pty) Ltd.
Intellidex staff may hold positions in financial instruments or derivatives thereof which are discussed in this document. Trades by staff are subject to Intellidex’s code of conduct which can be obtained by emailing mail@intellidex.coza.
Intellidex may also have, or be seeking to have, a consulting or other professional relationship with the companies mentioned in this report
|
|