
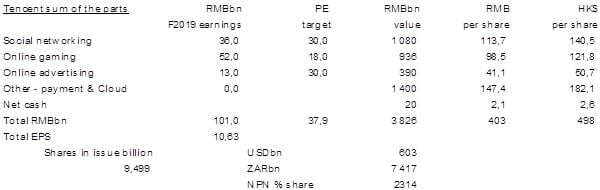
Tencent, now 31,2% owned by Naspers after selling 190 million shares or 2% of the 9,5 billion Tencent stock in issue, is reporting quarterly results on 16 May. And good results they will be too. Expect revenue to be up over 40% year-on-year with earnings 30% higher. Whilst there is short term margin pressure, in part due to the changing mix of business, free cash flow is strong, the business is in a net cash position with growing cash balances projected for the medium term, and compound growth in earnings is projected at over 20% over three years. My updated sum-of-the-parts table indicates a target price of HK$498 compared with the current share price of HK$406. The sum-of-the-parts also makes provision for other assets such as joint ventures and Cloud. Tencent has retreated from highs earlier this year of around HK$470 but is 60% higher than twelve months ago.
“Q1 Tencent results due 16 May”
Naspers [JSE:NPN]
Tencent [SEHK:700]
NPN share price ZAR: R3174
NPN net shares in issue: 431,6 million
NPN market cap ZAR: R1 369 million
700:HK share price: HK$406
700:HK net shares in issue: 9,5 billion
700:HK market cap HK$ 3,9 trillion
Portfolio Buy
What you need to know:
On 16 May 2018, internet giant Tencent reports Q1 earnings. Revenue is likely to have grown by over 40% year-on-year to about CN¥70 billion, driven by mobile gaming, social networking, and online advertising. Expect gross profit margin to be down by up to 3% to 48% on mix.
Net profit is estimated to be 30% higher at CN¥18 billion. Non-GAAP EPS is estimated at CN¥1,90 compared with CN¥1,49 in Q1 F2017 and a Q4 F2017 EPS of CN¥1,83.
Titles like Honor of Kings, QQ Speed, QQ Dance are popular in mobile although PC based games have a higher base from which to bat, such as the successful Dungeon & Fighters last year. The investment case remains the strong social platform and great content, which it continues to build out.
My expectation is that social networking revenue will grow by 46% year-on-year to CN¥17 billion, online games to grow by 24% to CN¥28 billion, and online advertising to grow 40% to almost CN¥10 billion and other revenue to double to CN¥15 billion.
Cost of sales is expected to grow by over 50% to around CN¥37 billion, hence gross profit increases by 30% to CN¥33 billion.
For the year to December 2018, total Group revenue is likely to be CN¥327 billion, with social networking at CN¥77 billion, online games at CN¥120 billion, online advertising at CN¥55 billion, and other revenue CN¥75 billion. This means that full year total revenue would be 37,5% higher.
I currently estimate EBITDA of CN¥118 billion for the year, for a margin of 36% versus 48% in F2017. Again, the changing mix of business accounts for this. I’d expect EBITDA margin to settle in the 30% to 32% region by F2020.
The balance sheet continues to strengthen. The Group is likely to grow net cash over the forecast period. Shareholders’ equity was CN¥277 billion at December 2017 and could end 2018 at CN¥290 billion.
Non-GAAP EPS for F2018 is projected at CN¥8,30, up 21,5%, increasing to CN¥10,60 in F2019, up 27,7%, and then CN¥12,50 in F2020, up 18%.
I have three-year compound EPS growth at 22%. If I assume EPS of CN¥8,30 for the year to December 2018, the PE ratio is 48,9x, which then falls to 398,3x for F2019. The three-year price earnings to growth ratio is 2,15x. On a PEG ratio metric, Tencent is reasonable value, particularly if I compare it to some pricey South African retailers.
My updated sum-of-the-parts table indicates that around HK$498 is a reasonable level. The sum-of-the-parts also makes provision for other assets such as joint ventures and Cloud.
Recommendation:
Tencent remains the driver of Naspers. With the Chinese yuan at CN¥6,35/$, the Hong Kong dollar at HK$7,85/$, and the rand at R12,31/$ the Naspers discount to the see-through value on Tencent is 27%, not far off the record discount of 32%. In other words, MultiChoice and other investments are worthless.
At the current Tencent share price and assuming the above exchange rates, if Naspers reflected its 31,2% share of Tencent, the share price would be R4373 per share, 38% higher than the current share price.
The negative difference between the see-through-value of the Tencent investment of R1,9 trillion and the Naspers market capitalisation of R1,4 trillion is over R500 billion or $42 billion.
Naspers remains buoyed by Tencent alone. I retain a Buy because of this but the fundamentals of Naspers absent this are questionable, and the realisation of $2,2 billion from an 11,8% share of Flipkart, the Indian ecommerce company bought by Walmart, does not move the needle. A narrowing discount to Tencent tends to be a signal to sell with a widening discount a time to buy.
Tencent share price in Hong Kong Dollars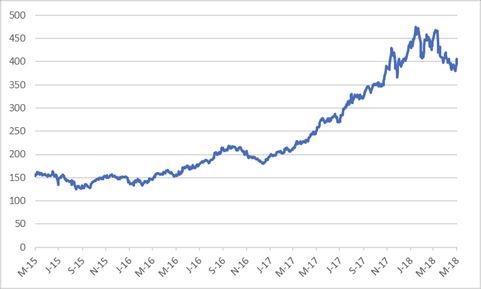
Naspers share price in Rands 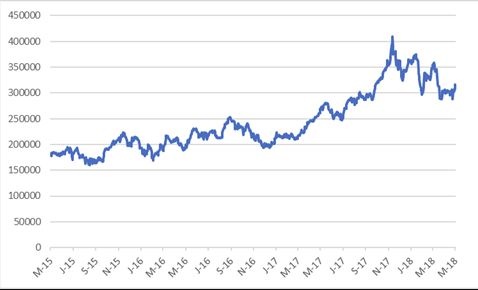
Did you find this note insightful?
Check out: Jaw not war, for now.
Wishing you profitable investing, until next time.
M N INGHAM