Aspen
Take a listen to Mark's thoughts here.
Share price: R329,00
Net shares in issue: 456,4 million
Market cap: R150,1 billion
Exit PE ratio 23,8x; forward PE 17,4x
Dividend yield 1,1%
Fair value: R390
Target price: R427
Trading Buy and Portfolio Buy
Key takeaway:
South Africa’s pharma champion, Aspen Pharmacare, reports annual results on Thursday.
Let’s call this the Caracas headache result – whilst hardly a large market for Aspen, Venezuela’s Bolivar currency gyrations play havoc with reported results.
These will be tricky results to analyse as there a number of moving parts, both operationally and from an accounting point of view, that need to carefully unpacked.
What we do know is the following:
Per the trading statement on Wednesday, 7th of September EPS and HEPS will be down by around 20% whilst normalised EPS will be up around 9% and comparable normalised EPS up 13% or so. It’s take your choice stuff.
By the end of the trading week, the stock was down 9% to 10%.
The trading statement though is in line with my estimate – I have had an estimate of 1256 cents for normalised EPS for the past few months and this compares with what will likely turn out to be an actual EPS of 1255 cents.
Normalised EPS is the number management focus on. How it is arrived at is more important than the actual figure through.
In normalised earnings, profit arising from the divestments, currency devaluation losses out of Venezuela and hyperinflationary adjustments relating to Venezuela are excluded.
In the first half of the financial year, the difference between headline earnings and normalised earnings was a significant R1,08 billion, with normalised earnings almost R3 billion and headline earnings R1,9 billion.
If all this sounds rather confusing, one should point a finger at the basket case that is Venezuela.
Comparable normalised EPS includes Venezuela income at the so-called DICOM rate, which is partially free-floating at VEF645/$ and closer to the black market rate of VEF1000/$. This compares with the fixed government rate used for pharma (a priority category) at VEF10/$.
In other words, there is a 100-fold difference between the all-but unusable DIPRO government rate and the black market parallel rate and a 64,5-fold difference between DIPRO and DICOM.
Fair value gains and losses and net foreign exchange gains and losses are notoriously volatile items and impossible to forecast with any accuracy.
On my estimate, underlying earnings are estimated to be R5,7 billion versus R5,2 billion in 2015. This is growth of 9,5% and suggests a broadly flat H2 result following the 14,5% growth in H1.
A few other things to take note of include the following:
The pharma company closed a significant new funding package in June. This debt refinancing will solve a mismatch between dollar borrowing and euro earnings. On EBITDA of R10 billion for the year ended June 2016 I estimate EBITDA interest cover of 5x with net debt at R32 billion. On assumed cash flows, I expect EBITDA interest cover to improve to 12,5x by 2018 at which time EBITDA is estimated at R16,6 billion.
Aspen has signed an agreement with AstraZeneca to acquire the exclusive rights to commercialise AstraZeneca’s global anaesthetics portfolio outside of the USA. The latest Glaxo deal too, announced 12 September, is earnings accretive and in line with its anaesthetics strategy.
The company has also closed a deal that aligns with its strategy to pursue commercial opportunities in the United States.
As Navamedic ASA isn’t renewing a distribution agreement from May 2017, this opens up new avenues for Aspen in the Nordic and Benelux markets.
Whilst the 2016 result may seem a bit weak on the surface, this is not an indication of any slowdown – quite the contrary. Revenue of around R38 billion in F2016 is estimated to grow to over R50 billion in F2017 whilst earnings are forecast to grow by over 50% to 1891 cents per share. Three year compound growth is estimated at 25%.
Recommendation:
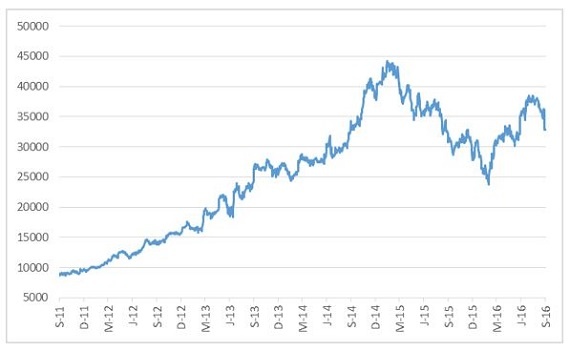
Whilst the stock reacted negatively to the recent trading statement, down to R329 at the time of writing from R362, this represents opportunity, as the investment case is unaltered. Even after the correction, APN is 37% up on the low in February.
My fair value is R390, a level almost reached in the past month when the stock exceeded R380.
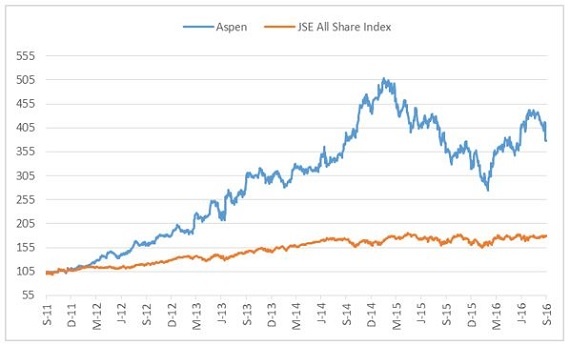
Aspen does to range quite widely within a fiscal year. In 2013, for example, the difference between the lowest price and the highest price recorded was 85% whilst this past year it has ranged in a 65% band. This is partly a function of investors waxing hot and cold on whether or not this is a growth stock.
Trading Buy and Portfolio Buymaintained with a fair value maintained at R390 with the target price R427.
Share price of Aspen Pharmacare in ZA cents

Aspen Pharmacare and JSE All Share Index based to 100
