NASPERS CONTRADICTION?!
Cable & Satellite Media
Naspers
“Trading statement context”
On Wednesday, the Bloomberg screens lit up with seemingly contradictory headlines – Naspers earnings per share for the year ended 31 March 2016 would be down by 20% to 25% whilst headline earnings per share would be up by 0% to 5% and so-called core earnings would be up by 15% to 20%.

An investor looking at further Bloomberg detail on the stock and seeing a price earnings ratio of 104x would doubtless get rather a fright in the absence of further context. After all, you don’t really want to pay 104 times earnings for a company that is reducing its earnings by 20% or so. In fact, if one had to simply take the prior year headline EPS number that multiple jumps to 1 284x.

As I mentioned in my note dated 16 May (“More brainy things”), commencing with the result for the year ended 31 March 2016, Naspers will be reporting in USD rather than ZAR and so one is no longer comparing apples with apples when it comes to the share price relative to reported earnings.
Naspers has switched to USD due to the fact that Naspers is truly a business of international scope with over 70% of revenue on an economic interest basis, including a proportionate share of the revenue of associates and joint ventures, external to South Africa.
Although the figures will now be in dollars, the functional currencies of the businesses are unaltered with all figures translated to USD.
Dividends will continue to be declared and paid in rand to South African investors, with the exchange rate announced at the time of the dividend payment.

With respect to that seemingly elevated PE ratio, the ratio is simply a numerator over a denominator and insufficient on its own as a determinant of true value.
Much of Naspers earnings are from equity accounted investments in which Naspers has no management control – for example 33,5% of Tencent and 29% of Mail.ru, both listed. There are numerous minority stakes in other unlisted companies. Just recently, Naspers increased its stake in Avito, the leading online classifieds platform in Russia, from 17,4% to 67,9% on a fully diluted basis.
The value of ecommerce lies in the future. The investment is being expensed and detracting from profits. There are a combination of loss making and profit making assets so the share price over the earnings per share gives an inflated PE ratio.

If you want a sanity check then Tencent is a better PE proxy. On my 2016 earnings estimate of CN¥4,57 per share (i.e. in Chinese yuan) then at a share price of HK$169 the forward PE ratio is 31x which is acceptable and in keeping with a business growing at over 30% for the foreseeable future.
What is also important to understanding this valuation conundrum is that Naspers has majority ownership MultiChoice (of which DStv is part) and Novus (a listed commercial printing group), two key cash generating assets. MultiChoice contributes more in cash earnings than Naspers receives from its Tencent dividend. This cash is very important for growth and development. The equity accounted investments are valuable in market capitalisation but many of the investments are still developing and either loss making or contributing below future intrinsic potential.
Whilst Tencent gets lots of attention and media copy, the assets under the radar punch above their weight in cash terms.
I estimate Tencent earnings to be the equivalent of $6,5 billion in 2016 of which Naspers shares in $2,18 billion – equivalent to R33 billion. However, because Tencent has a parsimonious dividend policy of 9,2x cover, preferring to retain for growth, the total dividend for 2016 will be approximately $700 million, relatively small in relation to earnings.
Naspers would share in that $700 million to the extent of $235 million or about R3,5 billion. By way of comparison, I estimate that earnings before interest, depreciation and amortisation from MultiChoice will be over 3x that.
In relation to reported earnings of Naspers, and that disparity, the following is relevant.
Naspers prepares reports in accordance with International Financial Reporting Standards (IFRS). Whilst IFRS reported figures are an accurate accounting representation of the result the figures may not necessarily be an accurate fundamental commercial representation of what the business has actually delivered.

So-called remeasurements are one example, which is gains, losses and disposals in relation to investments. This number can vary widely – in the first half of the year, when Naspers was still reporting in rand, this net gain reduced by 68% compared with the first half of fiscal 2015.
Impairment of goodwill and other intangible assets is another example as is dilution gains or dilution losses on equity-accounted investments – this figure was a R2 billion gain in the first half compared with a small loss.
To comply with the South African practice of providing headline earnings, some of these items are excluded in headline earnings. Headline earnings would add back impairments but also exclude one-off, non-trading items such as gains on acquisitions and disposals, certain remeasurements, dilution gains or losses on equity-accounted investments and a couple of other items.
In the first half of 2016, there was a negative difference of R2,1 billion between attributable earnings and headline earnings whereas in the corresponding period in 2015 there was a R4,5 billion negative difference.
However, there are other items, most of a non-cash nature, that headline earnings ignores and so Naspers makes a further adjustment to give a better sense of what the true commercial result was.
Typically, this “core headline earnings” number would exclude the amortisation charge, fair-value adjustments and currency translation differences, recognition or reversal of deferred tax assets and the potentially quite large equity-settled share-based charge. Tencent, for example, has what it calls “non-GAAP” earnings that also excludes share-based compensation, net gains or losses from investee companies and amortization of intangible assets and impairment provision.
Another thing to take account of is a slight dilution in 2016 and 2017 from the $2,5 billion equity raise in December 2015. A total of 18,2 million new Naspers N ordinary shares were placed with institutional investors at a price of R1 975 per share and represented 4,3% of Naspers’s issued N ordinary share capital prior to the capital raising.
This means Naspers has 18,2 million more shares to service for almost four months of the 2016 financial year and then for the full 2017 year.
In addition, there were share-based incentive scheme shares issued and so the weighted average number of shares in the first half was 3,6% higher than in the comparative period. For the full year, the weighted average number of shares, including the equity raise, will be about 3,2% higher than in 2015.
There are currently 437,92 million N shares in issue compared with 412,0 million as at 31 March 2015, an increase of 6,3%.
The comparatives on core earnings are as follows in the table, together with my the likely outcome for the year ended March 2016 as per the trading statement. The results are due out on Friday, 24 June and there is an analysts conference call on Monday, 27 June.

Naspers is thus likely to conclude the year to 31 March 2016 with dollar earnings up by 22% to $1 254 million and with dollar earnings per share on a core headline basis up by 18% to 301 cents. At an average exchange rate of R13,78/$ the growth in rand earnings translates to 54% at R17 280 million with the growth in rand earnings per share being 49% at 4148 cents.
My DCF value on Tencent based on free cash flows remains HK$174 per share with my sum of the parts value at HK$180 per share.

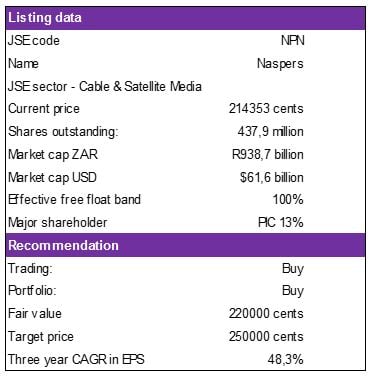
At prevailing currency rates, my value on Naspers, which takes Tencent into account and adds my derived values on MultiChoice, Novus and other print, and Ecommerce together with the market cap of mail.ru and then subtracts debt at centre, is R1,3 trillion. Deducting a 20% fair value discount, to provide a cushion for error, takes this to R1,0 trillion or R2370 per share.
If the rand had to go back to R14/$ from R15,25/$ at the time of writing, then the fair value drops from R2370 per share to R2200 per share. I am therefore keeping fair value at R2200 per share.
Trading Buy and Portfolio Buy maintained.
Subscribe To Our Research Portal
Search all research
Let Us Help You, Help Yourself
From how-to’s to whos-whos you’ll find a bunch of interesting and helpful stuff in our collection of videos. Our knowledge base is jam packed with answers to all the questions you can think of.