
Performance review
SA property has been one of the best-performing sectors over the past decade thanks largely to the low interest rate regime since the 2008/09 financial crisis.
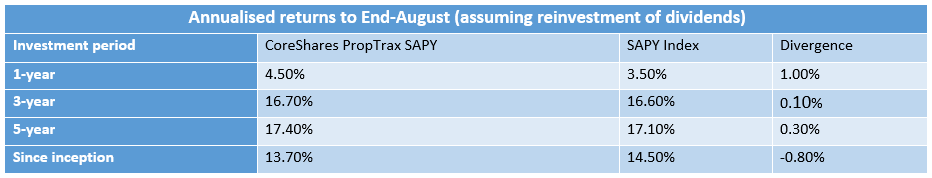
The South African Listed Property Index (JSE SAPY) returned 13.9% a year for the past 10 years, ahead of the all share index and all bond index which had total returns of 12.9% and 12.3% respectively. However, with US bond yields moving up – 10-year US treasury yields have risen from 1.36% to 1.8% since July – and SA’s interest rates more likely to rise than fall, property companies have started to come under pressure.
CoreShares PropTrax SAPY has shed 3% over the past year as most of the locally-based property stocks have fallen. The majority of stocks in the fund, including Growthpoint which accounts for 19% of the portfolio, lost between 3% and 5%. New Europe Property Investment and Rockcastle posted the biggest gains among the top 10 counters, gaining 16% and 26% respectively on the back of a weaker rand.
Outlook
The performance of property stocks is influenced by a variety of factors. Investors look at growth drivers such as rental demand, vacancies, funding costs and the value of each property to determine what the shares are worth. Future acquisitions or developments often drive up prices.
A quick valuation measure to look at when analysing property ETFs is the sector dividend yield – the annual dividend divided by the stock’s share price. Dividend yield can be viewed as the “interest rate” earned on an investment. Listed property is predominantly bought for the dividends and hence investors normally compare its yield with those of other income-generating asset classes such as cash, bonds or shares, but particularly bonds.
With SA government’s 10-year bond currently yielding about 8.8%, yield seekers are likely to prefer bonds over property stocks which are offering an average yield of 6%. The gap between the yields can narrow only if bond yields decline or if property stocks increase dividends, or their share prices decline. Note that there should be a gap anyway to compensate for the fact that interest earnings are taxable while dividends are not (in the hands of the recipient, anyway).
But given that interest rates globally are at historical lows and likely to rise, it’s difficult to see bond yields falling significantly or property companies increasing their dividends. As a geared asset, higher interest rates generally mean higher funding costs for property companies. This, coupled with a sluggish economic outlook, puts earnings under pressure, compromising the ability to pay strong, growing income streams. So if bond yields continue on an upward trajectory, which we think makes sense given the conditions on the ground, it’s not unreasonable to expect property stocks to underperform in the short- to medium-term as investors seek higher yields from bonds.

That scenario will, however, not hold in the long run. Sharp price declines in property stocks enhance their yield, which will see them becoming more attractive over bonds on a yield basis.
Such trends happen now and again and should not deter long-term investors. Fundamentals for local property companies are largely in good shape, with the poor economic outlook their main threat. If distributions grow roughly in line with inflation and you have a long investment horizon, attractive real returns are achievable even in a rising interest rate environment.
Suitability
CoreShares PropTrax SAPY is suitable for a long-term (more than five years) investors seeking to diversify a core portfolio but also wanting a steady flow of income. Investors with a short-term investment horizon that cannot handle volatility should refrain from investing in listed property as the risk is almost on par with that of the all share index.
What it does
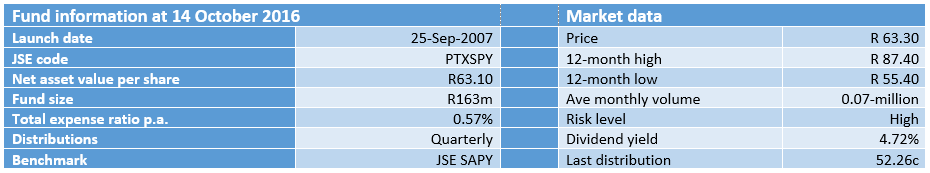
CoreShares PropTrax SAPY tracks the FTSE/JSE South African Listed Property Index (JSE SAPY) by holding constituent securities in the same weightings as they have in the underlying index.
Disadvantages
With a total expense ratio of 0.57%, CoreShares PropTrax SAPY is more expensive than its closest competitor, STANLIB SA Property ETF, which charges 0.37%. Growthpoint Properties and Redefine Properties account for 38% of the fund. The large weightings mean the performance of the fund will be biased towards the performance of these two stocks
Top holdings
The top-10 holdings constitute 84% of the overall portfolio with Growthpoint and Redefine Properties accounting for the majority of that stake. The JSE SAPY Index is made up of property stocks with primary listings in SA only. That effectively excludes Intu Properties and Capital & Countries Properties, which are the largest and third-largest listed property counters on the JSE respectively.
Fees
Total expenses take 0.57% from the fund each year.

Alternatives
Retail investors seeking exposure to property stocks have two other options: CoreShares PropTrax SAPY Ten Minimum managed by Grindrod Asset Management and Stanlib SA Property Exchange Traded Fund.
The Stanlib SA Property Exchange Traded Fund tracks the JSE SAPY index in a similar fashion to the CoreShares PropTrax SAPY. With over R9.2bn of assets under management, the fund is by the far the largest in the sector. It also offers the cheapest exposure with a total expense ratio of 0.37%.
Investors can also get property exposure through the CoreShares PropTrax SAPY PropTrax Ten Minimum. This ETF differs from the other two in that it tracks the FTSE/JSE SAPY Top 10 equal index. It holds the top 10 companies in SAPY in equal weightings of 10% each. While it won’t be as diversified as the other two it certainly caps investments in Growthpoint and Redefine. Also, by investing only the top 10 property companies, its underlying index is likely to be more liquid. It has a total expense ratio of 0.55%.
|