
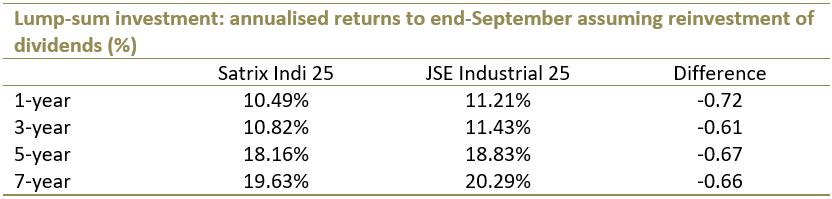
Performance review: Industrial companies have been the best performers on the JSE over the 10 years to end-September. This has been the top performing ETF in the last 10 years (many ETFs are less than 10 years old, so others have performed better but have a shorter track record). The Satrix Indi 25 ETF, delivered average growth of 16.27% a year. The fund’s returns for shorter periods are also impressive: 19.63% a year over the seven-year period and 18.16% a year over the five-year period.
.jpg?width=320&name=31102017(1).jpg) The Satrix Indi 25 has benefited immensely from strong performances by Naspers and Richemont, which now account for half of the fund. Over the past 10 years, Naspers delivered 32% a year (compounded annual return, assuming reinvestment of dividends) while Richemont returned 22% a year. In the graph alongside we’ve estimated the relative contribution of Naspers and Richemont to the growth of the index on a quarterly basis. In the last three quarters, the two companies have been responsible for all of the growth, and have often contributed most of the growth in previous quarters.
The Satrix Indi 25 has benefited immensely from strong performances by Naspers and Richemont, which now account for half of the fund. Over the past 10 years, Naspers delivered 32% a year (compounded annual return, assuming reinvestment of dividends) while Richemont returned 22% a year. In the graph alongside we’ve estimated the relative contribution of Naspers and Richemont to the growth of the index on a quarterly basis. In the last three quarters, the two companies have been responsible for all of the growth, and have often contributed most of the growth in previous quarters.
Outlook: The JSE Indi 25 is dominated by companies that generate the bulk of their revenue from markets outside SA. Its top five counters, accounting for more than two thirds of its market capitalisation, are heavily exposed to China, Europe, the Americas and Nigeria, including the top 3, Naspers, Richemont and British American Tobacco (see Top Holdings, below, for the full list). This has some advantages. Most of these markets have better growth prospects than our local economy. The International Monetary Fund is expecting world growth to come in at 3.5% this year and 3.6% in 2018. SA, unfortunately, is expected to continue lagging the rest of the world with growth of just 0.7% this year.
The exposure to markets outside SA also means the fund is not heavily exposed to the rising political uncertainties in the local economy. SA is going through a difficult patch politically. Political and policy uncertainty along with perceptions of widespread corruption have depressed business and consumer confidence. This is affecting local businesses the most. With more than two thirds of the revenue in foreign currency, the JSE Indi 25 also stands to benefit if the rand weakens further – which seem the most likely outcome if our economy remains depressed, political instability continues and further credit ratings downgrades ensue. The rand has so far helped returns for this fund: it has weakened from about R7/dollar 10 years ago to over R14/dollar today.
Invest in Satrix INDI ETF
Suitability: This fund is ideal for investors with a long-term investment horizon (more than five years) who can tolerate short-term volatility associated with equities. It can be used to diversify an equities portfolio that is heavily exposed to resources or financials
What it does: The Satrix Indi ETF tracks the 25 largest companies in the JSE’s industrial index, weighted by market capitalisation. Companies included in the index must meet a minimum liquidity (free-float) threshold of 15%. A free-float adjusted market capitalisation format is based on the market capitalisation of each company excluding locked-in shares such as those held by promoters, founders and government.
Drawback: Like other capped indices on the JSE, the Satrix Indi 25 is dangerously overweight in a few counters. Half of its funds are in Naspers and Richemont, both of which generate most of their money from China.
Top holdings: The top 10 holdings constitute 81% of the overall portfolio while the two biggest sub-sectors, consumer goods and consumer services, take up 80%. The biggest stock, Naspers, makes up 33% of the fund, followed by Richemont which accounts for 17%. BAT (6.77%), MTN (6.28%), Steinhoff (5.33%), Remgro (3.35%), Bidcorp (3.03%), Aspen (3.02%), Shoprite (2.71%) and Vodacom (2.54%) complete the top 10.
Risk: This is a 100% investment in equities with limited sector diversification. It is a riskier asset class than bonds or cash and is volatile, but the higher returns over time should compensate for volatility.
.jpg?width=554&height=158&name=31102017(2).jpg)
Fees: The total expense ratio (TER) is 0.40%. The costs consist primarily of management fees and additional expenses such as trading fees, legal fees, auditor fees and other operating expenses.
Alternatives: Its closest peer is Absa’s NewFunds S&P Govi SA Industrial 25, which uses intrinsic value and volatility in its selection criteria. NewFunds S&P Govi is trailing the Satrix Indi in terms of performance, but it is way cheaper with a TER of 0.21%.
Invest in NewFunds S&P Govi SA Industrial 25
Background: Exchange-traded funds (ETFs)
Exchange-traded funds (ETFs) are passively managed investment funds that track the performance of a basket of pre-determined assets. They are traded the same way as shares and the main difference is that whereas one share gives exposure to one company, an ETF gives exposure to numerous companies in a single transaction. ETFs can be traded through your broker in the same way as shares, say, on the EasyEquities platform. In addition, they qualify for the tax-free savings account, where both capital and income gains accumulate tax free.
Benefits of ETFs
- Gain instant exposure to various underlying shares or bonds in one transaction
- They diversify risk because a single ETF holds various shares
- They are cost-effective
- They are liquid – it is usually easy to find a buyer or seller and they trade just like shares
- High transparency through daily published index constituents
If you thought this blog was interesting, you should also read:
Disclaimer
This research report was issued by Intellidex (Pty) Ltd. Intellidex aims to deliver impartial and objective assessments of securities, companies or other subjects. This document is issued for information purposes only and is not an offer to purchase or sell investments or related financial instruments. Individuals should undertake their own analysis and/or seek professional advice based on their specific needs before purchasing or selling investments. The information contained in this report is based on sources that Intellidex believes to be reliable, but Intellidex makes no representations or warranties regarding the completeness, accuracy or reliability of any information, facts, estimates, forecasts or opinions contained in this document. The information, opinions, estimates, assumptions, target prices and forecasts could change at any time without prior notice. Intellidex is under no obligation to inform any recipient of this document of any such changes. Intellidex, its directors, officers, staff, agents or associates shall have no liability for any loss or damage of any nature arising from the use of this document.
Remuneration
The opinions or recommendations contained in this report represent the true views of the analyst(s) responsible for preparing the report. The analyst’s remuneration is not affected by the opinions or recommendations contained in this report, although his/her remuneration may be affected by the overall quality of their research, feedback from clients and the financial performance of Intellidex (Pty) Ltd.
Intellidex staff may hold positions in financial instruments or derivatives thereof which are discussed in this document. Trades by staff are subject to Intellidex’s code of conduct which can be obtained by emailing mail@intellidex.coza.
Intellidex may also have, or be seeking to have, a consulting or other professional relationship with the companies mentioned in this report.