Transportation
Imperial
“Hyundai’s blues unabated”

The latest vehicle sales statistics continue to indicated a weakening market. April new vehicle sales of 40 390 units were 4 079 units lower than April 2015, a fall of 9.2%. Of the total, 91% represents dealer sales, 4% corporate fleets sales, 3% car rental and 2% government.
Passenger units of 26 077 compares with 30 028 units in April 2015, a decline of 3 951 cars or a fall of 13.2%. The best April month was April 2006 when 34 440 units sold whilst the best ever month was August 2006 when 43 228 units sold.
April vehicle sales

Imperial’s Associated Motor Holdings continues to lose sales faster than the overall market with the recent April sales providing no relief. In April 2013, Imperial had 16.2% market share in passenger cars and in April 2016 this was 12.8% but in some months it’s has been closer to 10%.
April vehicle sales

In my last note on Imperial dates 18 April, I mentioned that Hyundai in South Korea had provided some relief, possibly up to 8%, on pricing of Hyundai and Kia cars ex-factory together with some support warranties and funding for new cars. Despite this relief, Imperial pricing remains uncompetitive versus the OEM’s due to unremitting exchange rate pressure and absence of manufacturing and export incentive offsets.
Between April 2013 and April 2016 the total passenger car market has fallen from 34 496 units to 26 077 units, a fall of 24.4%.
Imperial passenger car sales have fallen by 40.3%, from 5 604 units in April 2013 to 3 348 units in April 2016. Compact car sales have taken a larger share of Imperial’s declining sales and fell by 32.5% over the three years. SUV sales fell by an astonishing 78.9% from 593 units in April 2013 to 125 units in April 2016.
In large cars, Hyundai has no presence and does not offer cars such as the Sonata or Genesis in the local market whilst Kia has a modest mid-size and large presence with Cerato and Sedona.
Imperial sales by category

Larger vehicles earn more profit relative to more basis entry-level models. Imperial had 54% of its sales in the compact category in April and 27% in the mid-size category with only 3% in SUV’s – down from 9% in April 2013.
For the past few months, Imperial has shown sales declines at more than twice the rate of the total market.
Year-on-year percentage change

Commercial sales for the total market have been resilient, falling by only 8.6% from 15 657 units to 14 313 in April 2016 but in some months commercial sales have been pushing over 18 000 units. The category spans light, medium, heavy and extra heavy. In the light commercial segment (pick-up trucks) and extra heavy sales (big rigs), sales have held up particularly well. Toyota and Ford are the sales leaders in the light commercial segment with the Hilux and Ranger.

Imperial has a very small market share of 3% to 4% in commercial with only one light commercial Hyundai vehicle and one Kia medium commercial vehicle orientated toward the small and medium sized business.
Imperial’s car import business, which accounts for half of the Vehicle Import, Distribution and Dealerships division turnover, is at best breakeven. Total divisional margin for South Africa has fallen from close to 10% in 2013 to an estimated 3% this year and I estimate it could fall to 1% or less. I estimate total SA profits to be 67% lower in 2016 than in 2013 and 90% lower by 2017.
Imperial would need to see the rand closer to R12/$ rather than the current R15/$ to see real relief.
Whilst new car prices today are around 50% higher than at the start of 2012, Hyundai and Kia prices would need to be 90% higher to approximate currency weakness – and that is not possible.
Imperial has over 1 million imported cars is on the road – up 257% in ten years. In the short term, that is good business for aftermarket - service and parts.
However, cars are not being renewed at the same pace so as the universe ages and gets scrapped there will be fewer future cars to service. The precipitous decline in higher priced SUV sales – almost 80% in three years based on the latest April figures – is particularly negative in this regard.
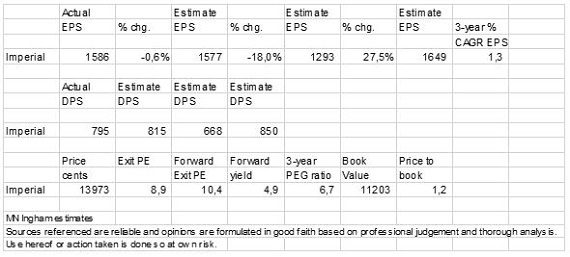
I am estimating a slight decline in Imperial group earnings for the year ended June 2016 followed by an 18% decline in 2017 before a turn for the better in 2018. Overall, a flat three year earnings outlook for the group is a reasonable assumption.
Imperial has bought the remaining 10% of AMH it does not already own from the CEO of AMH for R750 million. This deal, predicated on executive succession and a decision to combine Vehicle Import, Distribution and Dealerships with Vehicle Retail, Rental and Aftermarket Parts, has entailed the issue of shares worth R650 million and payment of R100 million in cash. The number of shares is 4,6 million and represent 2,4% of net issued shares prior to the transaction.
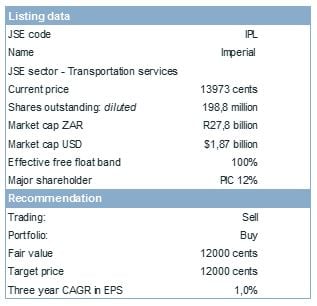
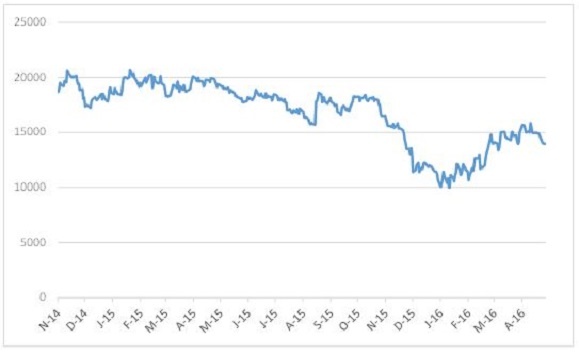
The share price at 13973 cents has eased back from levels closer to 16000 cents in the past month. There is little attraction for new money. Whilst the yield of 5.8% is attractive on a forward view, if earnings do decline in 2017 and with it the dividend then this falls to below 5%. With a forward PE ratio to June 2016 of 8,7x this is a value stock although in a scenario of earnings decline then the 2017 forward PE ratio is a little less attractive at 10,6x.
The appeal thus lies only in the dividend income and yield for the foreseeable future.
Institutions with a longer view and patience have been taking interest in Imperial at lower levels.
My fair value on Imperial remains 12000 cents per share.
Trading Sell and Portfolio Buy maintained.
Estimates for Imperial
Source: company and MN Ingham

Imperial share price cents

