Intellidex Reviews: Satrix INDI ETF
Suitability: The Satrix INDI ETF is ideal for investors with a long-term investment horizon (more than five years) who can tolerate short-term volatility associated with equities. The ETF provides exposure to the 25 biggest companies in the JSE’s industrial index. It can be used to diversify an equities portfolio which is heavily exposed to resources or financials. As an equities asset class, the ETF produces above-inflation returns and performs better than bonds and cash over long periods. The industrial index tends to be more volatile than the Top 40 index so represents relatively high risk within the broad equities asset class.
What it does: The Satrix INDI ETF provides investors with exposure to the 25 largest companies in JSE’s industrial index weighted by market capitalisation.
Companies included in the index have to meet a minimum liquidity (free-float) threshold of 15%. A free-float adjusted market capitalisation format is based on the market capitalisation of each company excluding locked-in shares such as those held by promoters, founders and governments. It provides investors with the price return of the FTSE/JSE Industrial 25 index. Each quarter, dividends received for the shares in the index are paid to investors. The fund engages in scrip lending activities, so as to reduce costs and minimise tracking error. Scrip lending is done with credible counterparties: Investec, RMB and Sanlam. Manufactured dividends may arise from such transactions. This is when dividends that accrue on borrowed securities are passed on to the lender (investors in the fund). The fund is rebalanced quarterly in line with the FTSE/JSE index rebalancing methodology.
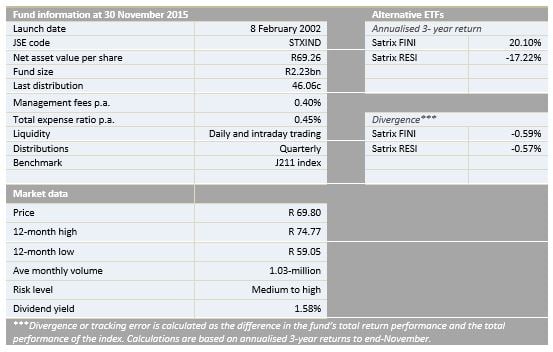
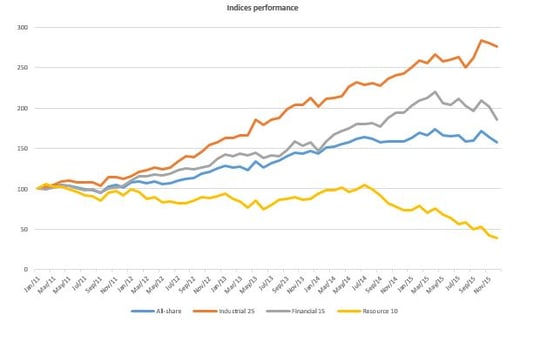
Industrials is one of the three broad sector categories on the JSE, the other two are financials and resources. Of the three broad JSE categorisations, industrials has had the best performance in the last five years, outperforming the all-share index. The Satrix INDI fund has generated an annualised return of 24.2% for the past three years with a tracking error of -0.71%. It is the only ETF on the JSE which tracks the Industrial 25 index.
Advantages
In addition to improving the risk-return properties of a portfolio of broad asset classes (bonds, cash and alternative), in the long run, it theoretically outperforms other major asset classes such as bonds and cash.
More than 80% of the constituents are consumer-consumption driven. It means the fund is less susceptible to demand shocks given that consumer demand is the biggest and one of the most stable components of GDP.
Most of the constituents earn significant non-rand earnings which mitigates both country and currency risks
Disadvantages
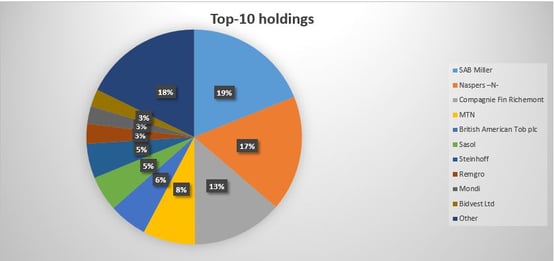
It is poorly diversified with the top-three companies constituting about 50% of the fund.
Further, it has high sectoral concentration.It is an all-equities fund and traditionally exhibits higher volatility when compared with other asset classes such as bonds and cash
Top holdings: The top 10 holdings constitute 82% of the overall portfolio while the two biggest sub-sectors, consumer goods and consumer services, take up 70%. The biggest stock, SABMiller, is 19% of the fund.
Risk: This is a 100% investment in equities with limited sector diversification. It is a riskier asset class than bonds or cash and is volatile, but the higher returns over time should compensate for volatility.

Fees
The total expense ratio is 0.45%. The costs consist primarily of management fees and additional expenses such as trading fees, legal fees, auditor fees and other operating expenses.
Historical performance
The performance of an investment in the Satrix INDI ETF depends on the method used to invest. A lump-sum investment will mimic the ETF performance. However, investing through regular instalments will see the performance lag the ETF, according to historical evidence, and the pattern is apparent in other ETFs too. This supports the notion that returns are best achieved through a long investment horizon. So the performance described in the table below is for a lump-sum investment.

Of the three broad JSE categorisations, industrials has had the best performance in the last five years, outperforming the all-share index. The Satrix INDI fund has generated an annualised return of 24.2% for the past three years with a tracking error of -0.71%. It is the only ETF on the JSE which tracks the Industrial 25 index. The performance is in line with market developments and the significant non-rand earnings. On the other hand, resources have performed poorly as commodity prices plummeted to record lows.
Fundamental view
Half the fund is exposed to consumer goods and consumer services sub-sectors. Also a significant chunk of business is generated across different continents. So the major macroeconomic issues affecting consumer goods and services sector are the exchange rate and global consumer spending. The fund is set to maintain good performance given the weakening rand and poor fundamentals to support the rand’s recovery as well as a relatively low exposure to the weak SA economy.

However, its growth potential looks priced in by the market given its high price:earnings of 23 compared to the all-share (18) and financials (10). The resources index has a higher multiple of 31 mainly due to poor earnings.
Although the fund has elevated risk due to sector concentration, sub-sectors are reasonably spread. Also it is exposed to the biggest yet most stable component of global income, consumer consumption, which mitigates this risk.
Alternatives
There are no direct comparisons which track the Industrial 25 index. But we have drawn parallels with other broad JSE equity classifications, financials and resources. Satrix FINI ETF fund tracks the price performance of FTSE/JSE Financial 15 index which contains fifteen largest market-cap weighted JSE equities classified as financials. Satrix FINI has returned an annualised return 20.1% per annum with a tracking error of -0.59%. On the other hand, Satrix RESI which tracks FTSE/JSE Resource 10, has experienced negative growth of -17.2% per annum.

Disclaimer
This research report was issued by Intellidex (Pty) Ltd. Intellidex aims to deliver impartial and objective assessments of securities, companies or other subjects. This document is issued for information purposes only and is not an offer to purchase or sell investments or related financial instruments. Individuals should undertake their own analysis and/or seek professional advice based on their specific needs before purchasing or selling investments. The information contained in this report is based on sources that Intellidex believes to be reliable, but Intellidex makes no representations or warranties regarding the completeness, accuracy or reliability of any information, facts, estimates, forecasts or opinions contained in this document. The information, opinions, estimates, assumptions, target prices and forecasts could change at any time without prior notice. Intellidex is under no obligation to inform any recipient of this document of any such changes. Intellidex, its directors, officers, staff, agents or associates shall have no liability for any loss or damage of any nature arising from the use of this document.
Remuneration
The opinions or recommendations contained in this report represent the true views of the analyst(s) responsible for preparing the report. The analyst’s remuneration is not affected by the opinions or recommendations contained in this report, although his/her remuneration may be affected by the overall quality of their research, feedback from clients and the financial performance of Intellidex (Pty) Ltd.
Intellidex staff may hold positions in financial instruments or derivatives thereof which are discussed in this document. Trades by staff are subject to Intellidex’s code of conduct which can be obtained by emailing mail@intellidex.coza.
Intellidex may also have, or be seeking to have, a consulting or other professional relationship with the companies mentioned in this report.
Subscribe To Our Research Portal
Search all research
Let Us Help You, Help Yourself
From how-to’s to whos-whos you’ll find a bunch of interesting and helpful stuff in our collection of videos. Our knowledge base is jam packed with answers to all the questions you can think of.