Intellidex Reviews: Ashburton MidCap ETF
Only R7.4bn, equivalent to less than 1% of assets in retail unit trusts and ETFs, is invested in mid- and small-cap funds, statistics from the Association of Savings and investment South Africa show. This means that many investors are likely to be overweight in blue chips and multinational companies – the favourites of most fund managers – not only through their retail investments but also through their pension funds. Investing your discretionary income into a mid-cap ETF may therefore make sense to diversify your overall exposure.
The arguments for investing in large caps are undisputable. Because they are so large and have well-established reputations with consumers, large companies are less likely to face turmoil in their markets. Most are also very liquid compared with their smaller counterparts. Furthermore, many of them have operations in various countries outside of SA, so they provide geographical and currency diversification benefits, which are important.
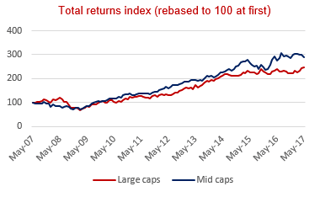
 However, that doesn’t mean counters occupying the middle and lower parts of the market should have no part in your portfolio as they play an important diversifying role. They can also be very good earnings enhancers, particularly over the long term when the higher day-to-day volatility in share prices of the smaller companies becomes less relevant from a risk perspective. Various academic studies also show that over the long run they outperform large caps.
Post the 2008/2009 recession, the mid-cap index has consistently outperformed the large-cap index. The Ashburton MidCap ETF, which was launched about four years ago, has benefited immensely from this strong performance. It gained about 61% over the period with a pretty decent dividend yield of 3.33%.
Outlook
Unlike their larger peers that generate a chunk of their income outside of SA, most counters in this fund are domestically focused. At a time when the rand is expected to weaken as a result of SA’s credit rating downgrade and the economy is facing strong headwinds, earnings of mid-cap companies could come under pressure. But many within this universe have been through painful restructuring processes to re-align their business models to lower levels of domestic economy activity. In other words they are geared to cope with difficult times.
The recent commodity crisis brought some changes to the composition of the mid-cap index which we think could also be material to the performance of the fund. Prior to the commodities price slump that started towards the end of 2013, mining houses such as Gold Fields, Lonmin, Implats, Exxaro and Kumba Iron Ore were among the top 40. But with the deterioration in the sector these counters were relegated into the mid-cap section, which increased the weight of resources in the index. This may turn out to be an advantage for the mid-cap index now that commodity prices are improving.
The mid-cap index is on a price:earnings ratio (PE) of 16.21, which is in line with its historical long-term average. The top 40 index is on a PE of 20.
Suitability:
This ETF is suitable for those whose portfolios are overweight in large-cap companies, who have a long-term investment horizon (more than five years) and can stomach short-term volatility.
What it does
The RMB MidCap ETF provides investors with exposure to the 41st to 100th largest companies on the JSE in terms of market capitalisation.

Main attraction
Most local mid-caps are not bite-size versions of their large-cap peers, but have fundamentally different characteristics. So, with your overall portfolio most likely being overweight in large caps, this ETF may bring much-needed diversification.
Drawback
The index methodology, which restricts investments in the 41st to 100th largest companies on the JSE, has its weaknesses. Unlike the top 40 index which locks in its top performers, the mid-cap index tends to lose its best performers to the top 40. For instance, PSG has been one of the best-performing midcaps over the past few years but has now moved up into the top 40. The fund’s 10 biggest companies also tend to be dominated by rejects from the top 40 index. This drawback, though, is eliminated if you also have exposure to the top 40 through other investments.
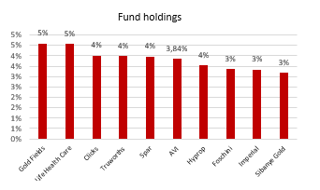
 Top holdings: The top 10 holdings constitute 35% of the overall portfolio. Consumer goods and services counters account for about 30% of fund, followed by financials with 18.76%.
Fees : The Ashburton MidCap ETF has an average annual total expense ratio (TER) of 0.8%, which is steep compared with other ETFs. The TER does not include costs of purchasing, selling and owning the ETF and commissions paid to intermediaries.
Alternatives
There are no alternatives for this ETF.
Background: Exchange-traded funds (ETFs)
Exchange-traded funds (ETFs) are passively managed investment funds that track the performance of a basket of pre-determined assets. They are traded the same way as shares and the main difference is that whereas one share gives exposure to one company, an ETF gives exposure to numerous companies in a single transaction. ETFs can be traded through your broker in the same way as shares, say, on the EasyEquities platform. In addition, they qualify for the tax-free savings account, where both capital and income gains accumulate tax free.
Benefits of ETFs
- Gain instant exposure to various underlying shares or bonds in one transaction
- They diversify risk because a single ETF holds various shares
- They are cost-effective
- They are liquid – it is usually easy to find a buyer or seller and they trade just like shares
- High transparency through daily published index constituents
If you thought this blog was interesting, you should also read:
Krugerrand Custodial Certificates
Disclaimer
This research report was issued by Intellidex (Pty) Ltd. Intellidex aims to deliver impartial and objective assessments of securities, companies or other subjects. This document is issued for information purposes only and is not an offer to purchase or sell investments or related financial instruments. Individuals should undertake their own analysis and/or seek professional advice based on their specific needs before purchasing or selling investments. The information contained in this report is based on sources that Intellidex believes to be reliable, but Intellidex makes no representations or warranties regarding the completeness, accuracy or reliability of any information, facts, estimates, forecasts or opinions contained in this document. The information, opinions, estimates, assumptions, target prices and forecasts could change at any time without prior notice. Intellidex is under no obligation to inform any recipient of this document of any such changes. Intellidex, its directors, officers, staff, agents or associates shall have no liability for any loss or damage of any nature arising from the use of this document.
Remuneration
The opinions or recommendations contained in this report represent the true views of the analyst(s) responsible for preparing the report. The analyst’s remuneration is not affected by the opinions or recommendations contained in this report, although his/her remuneration may be affected by the overall quality of their research, feedback from clients and the financial performance of Intellidex (Pty) Ltd.
Intellidex staff may hold positions in financial instruments or derivatives thereof which are discussed in this document. Trades by staff are subject to Intellidex’s code of conduct which can be obtained by emailing mail@intellidex.coza.
Intellidex may also have, or be seeking to have, a consulting or other professional relationship with the companies mentioned in this report.
Subscribe To Our Research Portal
Search all research
Let Us Help You, Help Yourself
From how-to’s to whos-whos you’ll find a bunch of interesting and helpful stuff in our collection of videos. Our knowledge base is jam packed with answers to all the questions you can think of.
