
I’ve cautioned on exposure to retail and apparel retail in particular for many months.
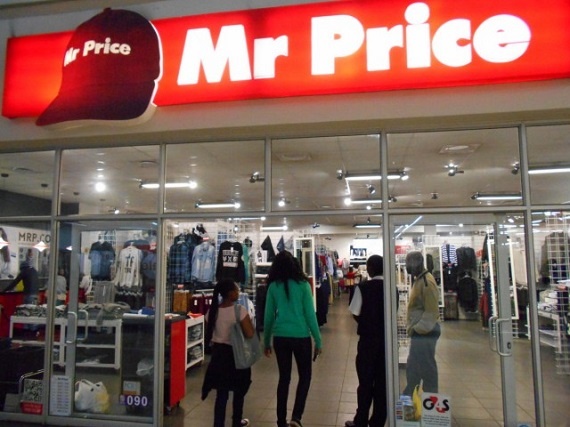
Mr Price has been particularly overpriced in relation to its business fundamentals and earnings outlook and I have rated it a Trading Sell.
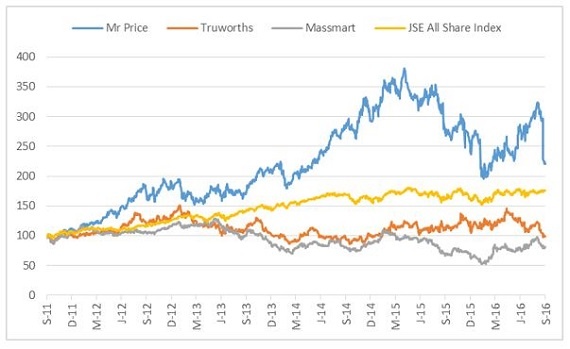
Mr Price, Truworths, Massmart and JSE All Share Index based to 100
As a reminder, at the current rate of interest my share buyback model indicates an EPS breakeven level of R135 per share for Mr Price. This compares with the current share price of R165 and levels of over R230 a few weeks ago. Mr Price is down 30% from recent highs and 40% lower than highs in April 2015.
At R165, the PE on the basis of my EPS estimate for the year ended March 2017 of 1055 cents is 15,6x. I am currently estimating 2% earnings growth for F2017 and have three year compound growth at 7%.
Assuming a full year dividend of 680 cents the forward yield is 4% whilst a price of R135, in line with my buyback breakeven level, entails a yield of 5%. A much weaker price therefore offers attraction for those seeking an attractive income yield.
Another stock to continue being cautious on is Truworths. The metrics below are illustrative in this regard.
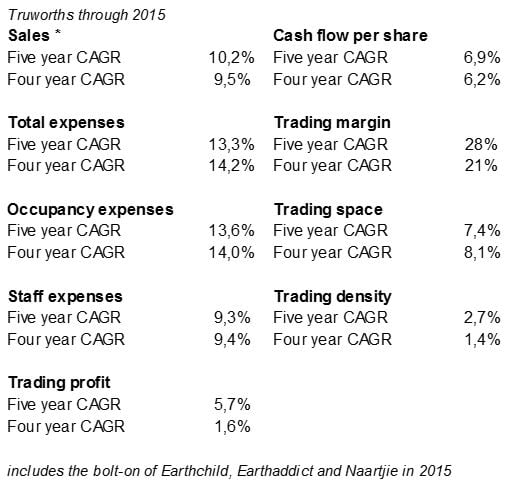
Expenses growth has exceeded topline and hence the declining margin and rate of growth in profit. Rental escalation is running at 7% per annum currently whilst staff costs typically rise by 8% to 9% per annum.
You need comparable sales growth to be in line with expenses for profit margins to hold up. With costs sticky and inflexible, a softer sales environment or a lack of ability to pass through price rises means negative operating leverage and lower profitability.
Truworths have repurchased shares over the years, which has assisted EPS.
If I break down the cost components of Truworths then I get like for like costs up 8,5% in a steady state situation. If sales had to grow by 6% (nominal GDP - i.e. assuming zero real growth), gross profit margin stayed the same, and other income increased by 4%, then trading profit would rise by less than 2% whilst the trading margin would fall by 1%.
However, if we assume flat sales and GP margin the same then with costs rising trading profit falls by 15% and the margin falls by 3%.
Trading density in retail is a key metric I look at. Truworths is not the only retailer struggling to improve trading density. In 2015, density increased by only 0,8% even as store space increased by 7,7%.
The 2016 financial results, published recently, and now include the Office acquisition in UK. Like-for-like it reflects similar trends - declining real sales growth with units sales again negative, like for like employment costs up 11%, like for like occupancy costs up 9%, trading margin down to 20,6%,

All retailers have to keep sales growing by high single digits to stand still.
For the first six months of this fiscal Massmart's staff costs are up 9,4% and occupancy costs up 11,8% with other operating costs up 9,7%. Total expenses grew by 10,4%. Unless you can reduce cost of sales to boost GP or grow revenue by at least 10% in that scenario you are continuing to go backwards.
When Mr Price says in its 18 week update that earnings for the first half are unlikely to exceed the comparative period last year it is something of an understatement.
Going back to the analysis I did last year on Massmart, there are similarities with Truworths. Investors have been paying up for declining profitability and reduced quality of profit.
That the Truworths share price has been flat overall for five years - moving in a band of roughly R70 to R100 - is actually quite good in relation to these metrics. This included a reasonably firm period for consumer demand.
In 2010, the year-end share price for Truworths was 5575 cents and the PE 14,7x. As at June 2015 the price was 8649 cents and the PE 14,6x. If I take cash flow per share the ratio is 15,1x for 2010 and 16,8x for 2015.
The stock is now 7550 cents. If I back out Office for the seven month period I get EPS of around 650 cents rather than the adjusted 688 cents reported. On that basis the stock is on a PE of 11,6x.
If I assume a full year of Office then we get to a forward PE of around 10x. But this of course assumes that earnings will keep growing. If SA earnings fell 15% even as Office kept earnings constant then the forward PE is 12x.
Truworths’s share price is down almost 20% since before the results and around 25% since June. There is insufficient motivation for fresh money even as the PE has degraded further. Truworths is fundamentally an ex growth stock if you strip out the "purchased" growth through store openings. That suggests a single digit multiple.
Whilst these are good businesses with proven management, there are limitations to growth and earnings sustainability given challenging macros, heightened competition, consumer price sensitivity and inflation. One size does not fit all and it is important to have an understanding of the differentiation between businesses.
Share prices of Mr Price, Truworths and Massmart in ZA cents and JSE All Share Index value (right axis)
