
Although SA is known globally for its minerals, it is the financial sector that contributes more to its GDP, accounting for 22% last year compared with mining’s 8%. The JSE has three main subsectors – financials, industrials and resources. Investors can gain exposure to each of them through a number of specialist ETFs available on the JSE.
This week we look at Absa’s NewFunds S&P Givi SA Financial 15 ETF. It is one of two ETFs that provide exposure to the financial sector – the other is the Satrix FINI. They use different weighting approaches.
The NewFunds ETF is weighted by intrinsic value and expected earnings, which is calculated by the fund issuer based on consensus forecasts from analysts in the market. The Satrix fund weights companies according to their market capitalisation. The NewFunds ETF therefore has characteristics of forward-looking active fund management, while the Satrix fund conforms to passive index tracking. This is known as a “smart beta strategy” to distinguish it from normal passive index tracking.
Invest in the NewFunds S&P Givi SA Financial 15 ETF:

What it does: The fund replicates the price performance of the S&P GIVI SA Financials Index, which represents 15 stocks from the S&P GIVI SA composite, constructed using GICS financials sector classification (see below for a key to this alphabet soup). “Intrinsic value” is defined as the book value of the company adjusted for future earnings prospects, derived from consensus forecasts of financial analysts. The approach favours counters with the highest intrinsic value and lowest volatility, subject to certain liquidity constraints. However, the maximum weight of each stock in the index is capped at 30%.
Here is what the acronyms stand for:
- GIVI stands for Global Intrinsic Value Index
- GICS means Global Industry Classification Standard. It is a globally accepted asset classification methodology (a way of deciding whether a stock is a “financial” or “industrial” for example) developed in 1999 by Morgan Stanley Capital International (MSCI) and Standard & Poor's (S&P).
Performance review: The fund has consistently and significantly underperformed its index. The main reason is that, for performance comparison, Absa uses a benchmark index which is fundamentally different from the fund in terms of construction/weighting. Whereas the fund is constructed using S&P GIVI rules which focus on intrinsic value and volatility, the FTSE/JSE index is a market-weighted index. What has been revealed here is that the pure indexing strategy has consistently outperformed a smart beta strategy.
|
Lump-sum investment: annualised returns to end-June in rands assuming reinvestment of dividends (%) |
|||
|
S&P Givi SA Financial 15 Fund |
FTSE/JSE Financial 15 index |
Difference |
|
|
1-year |
-9.47 |
2.89 |
-12.36 |
|
3-year |
-2.85 |
4.16 |
-7.01 |
|
5-year |
9.81 |
13.04 |
-3.23 |
|
Since inception |
13.63 |
16.00 |
-2.37 |
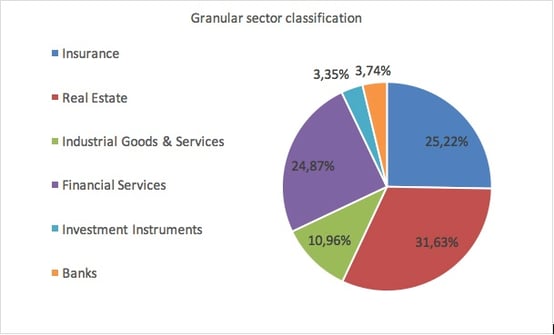
Outlook: The fund provides concentrated exposure to financial companies. Unlike diversified funds such as those that track the top 40 index, specialist fund constituents are likely to move together in the same direction, which reduces diversification benefits and increases risk. However, in practice the fund shows more diversification than implied – real estate constitutes the highest sector weighting while the fund also holds investment companies such as Remgro which have exposures to a diversified range of companies.
Generally, financial stocks are driven by levels of business and consumer confidence, and interest and exchange rates. Due to SA’s poor economic performance in recent years, confidence has been low, and there is no strong political will to make sweeping policy changes to get the economy on a recovery path.
The Reserve Bank’s Monetary Policy Committee resumed a softening of interest rates in July, but this month it left rates unchanged, due to what it says are heightened uncertainties in the economy. Businesses and consumers tend to borrow more and service existing debt better in a lower interest rate environment, which is good for the performance of banks. However, banks face margin compression in a low interest rate environment, which can swamp the effect of improved affordability. On a net basis, the poor economic conditions facing SA are bearish for the performance of financials.
Key facts:
Suitability: Subsector funds can be used as “building blocks” to assemble a portfolio with different sector weightings from those found in broader diversified portfolios. Furthermore, they allow you to fine tune your exposures, depending on your views of the likely prospects for different sectors – for instance in a core-satellite portfolio strategy in which a simple core index tracking portfolio can be complimented with strategic concentrated sector exposures. These funds suit more active investors who want to take a view on the prospects of different segments of the economy. For less active investors, a broader fund with wider exposures is probably more appropriate, such as a top 40 fund.
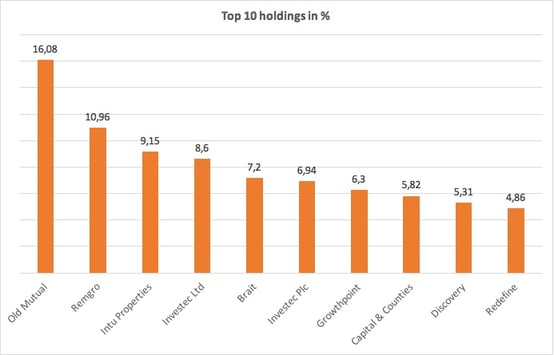
Top holdings: The top 10 holdings constitute 81% of the overall portfolio; the fund only has a total of 15 stocks. The biggest holding, Old Mutual, makes up 16% of the fund.
Risks: There are two important risks to consider. First, the fund is concentrated in one sector and all companies are responsive to similar risk factors. It is important therefore that this ETF forms part of a portfolio’s wider equity holdings that includes other sectors such as industrials. Second, it is an all-equity investment which is more volatile than other asset classes such as bonds and cash.
There is a third potential risk: although the fund tries to limit the idiosyncratic risk of individual assets by capping them at 30% of the portfolio, we think the cap is too high and the fund’s performance could potentially be skewed by one asset. However, the fund’s current weightings do not reflect this.
Alternatives: Its closest peer is the Satrix FINI ETF, which weights companies according to size and has a total expense ratio of 0.38% against this fund’s 0.18%.
Fund information at 30 June 2017 |
|
Market data at 22 September 2017 |
||
|
Launch date |
15 June 2009 |
|
Price |
R39.67 |
|
JSE code |
GIVFIN |
|
12-month high |
R40.94 |
|
Net asset value per share |
R38.06 |
|
12-month low |
R35.80 |
|
Fund size |
R50.3m |
|
Ave monthly volume |
97,310 |
|
Total expense ratio (TER) p.a. |
0.18% |
|
Risk level |
Moderate |
|
Distributions |
Quarterly |
|
Dividend yield |
1.5% |
|
Benchmark |
S&P GIVI SA Financials Index |
|
|
|
Invest in the NewFunds S&P Givi SA Financial 15 ETF:
Background: Exchange-traded funds (ETFs)
Exchange-traded funds (ETFs) are passively managed investment funds that track the performance of a basket of pre-determined assets. They are traded the same way as shares and the main difference is that whereas one share gives exposure to one company, an ETF gives exposure to numerous companies in a single transaction. ETFs can be traded through your broker in the same way as shares, say, on the EasyEquities platform. In addition, they qualify for the tax-free savings account, where both capital and income gains accumulate tax free.
Benefits of ETFs
- Gain instant exposure to various underlying shares or bonds in one transaction
- They diversify risk because a single ETF holds various shares
- They are cost-effective
- They are liquid – it is usually easy to find a buyer or seller and they trade just like shares
- High transparency through daily published index constituents
If you thought this blog was interesting, you should also read:
Disclaimer
This research report was issued by Intellidex (Pty) Ltd. Intellidex aims to deliver impartial and objective assessments of securities, companies or other subjects. This document is issued for information purposes only and is not an offer to purchase or sell investments or related financial instruments. Individuals should undertake their own analysis and/or seek professional advice based on their specific needs before purchasing or selling investments. The information contained in this report is based on sources that Intellidex believes to be reliable, but Intellidex makes no representations or warranties regarding the completeness, accuracy or reliability of any information, facts, estimates, forecasts or opinions contained in this document. The information, opinions, estimates, assumptions, target prices and forecasts could change at any time without prior notice. Intellidex is under no obligation to inform any recipient of this document of any such changes. Intellidex, its directors, officers, staff, agents or associates shall have no liability for any loss or damage of any nature arising from the use of this document.
Remuneration
The opinions or recommendations contained in this report represent the true views of the analyst(s) responsible for preparing the report. The analyst’s remuneration is not affected by the opinions or recommendations contained in this report, although his/her remuneration may be affected by the overall quality of their research, feedback from clients and the financial performance of Intellidex (Pty) Ltd.
Intellidex staff may hold positions in financial instruments or derivatives thereof which are discussed in this document. Trades by staff are subject to Intellidex’s code of conduct which can be obtained by emailing mail@intellidex.coza.
Intellidex may also have, or be seeking to have, a consulting or other professional relationship with the companies mentioned in this report.