
Mr Price is a good apparel retailer that is mispriced. After climbing by 37% since the end of November and by over 60% in six months the valuation is more stretched than it has been historically, as is the domestic retail sector, which now trades on an aggregate forward PE of 21x. On a one-year forward PE ratio of 24,7x, Mr Price is above a ten-year mean of 15x. It was only this expensive in 2015 when the nominal share price was in line with where it is today, before falling sharply. An enthusiastic Ramaphosa rally has added fuel. A useful comparison is Tencent, which on a price earnings to growth ratio is cheaper than Mr Price and growing at a fast pace with clear technology differentiators. Unless Mr Price can continue to increase profit margin every year there is no plausible reason it can increase earnings by double digits. Together with a high PE ratio and PEG ratio there is a modest dividend yield so there is no compensation. On a DCF and share buyback valuation methodology I derive fair value of R160 per share, which also coincides with the ten-year mean forward PE ratio.
“Mispriced”
Mr Price Group Ltd [JSE:MRP]
APPAREL RETAIL
Share price: R285,00
Net shares in issue: 256,3 million
Market cap: R72,1 billion
Forward PE F2018: 26,8x
Forward PE F2019: 24,7x
Forward dividend yield 2018: 2,5%
Forward dividend yield 2019: 3,1%
Fair value and target price: R160,00
Trading Sell and Portfolio Sell
What you need to know:
After climbing by 37% since the end of November and by over 60% in six months the valuation of Mr Price is more stretched than it has been historically. Whilst the South African retail sector trades at a discount to some other emerging market retailers, that is an insufficient reason for the local rating to be elevated given that growth drivers are palpably absent.
The rally in the local stock market since the election of Mr Ramaphosa to ANC President in December is at odds with a grim economic backdrop, even as there are seemingly positive winds of change blowing on the political front.
The local retail sector now trades on an aggregate forward PE of 21x. On a one-year forward PE ratio of 24,7x, Mr Price is above a ten-year mean of 15x.
It was only this expensive in 2015 when the nominal share price was close to where it is today. I had a sell recommendation then and could only justify a fair value of approximately R150 on both a DCF and share buyback valuation.
Today, with the share price at R285 and with the interest rate at 10%, for Mr Price to purchase its own shares would be earnings per share dilutive. For the share to revert to its longer-term price earnings ratio mean would entail a retreat to around R160. Whilst momentum could keep the stock elevated for a while there is no room for negative surprises as the share is at perfection levels.
For the year to March 2018 I currently have diluted headline earnings per share of 1064 cents. This increases by 8,5% to 1154 cents in F2019 and then by 8,6% to 1253 cents in F2020. I have the F2018 annual dividend at 800 cents, with a cover ratio of 1,33x, growing to 868 cents and 942 cents thereafter.
Earnings growth is assumed to be in line with revenue growth as the scope to continually increase profit margin is not plausible. The operating profit margin already exceeds 15%, which is better than many peers internationally.
Even revenue growth of 7% or 8% could be considered very good in a stretched and increasingly competitive retail landscape. Ever increasing space growth is essentially buying growth from the future. The core Mr Price brand grew space by 6,6% in 2016 and by 4,7% in 2017 and continued to grow space for the first six months of the current financial year. Mr Price Sport grew space by 6,5% in F2017.
Trading density, sales per square meter, is a metric I watch carefully with retailers. Mr Price is already under pressure. The core Mr Price apparel business had a 6% slippage in trading density in F2017 and for the six months to 30 September 2017 this slipped further whilst Mr Price Sport had a 3,5% reduction.
Stock at R285 is lofty for retail with a forward PE of 26,8x and a gross dividend yield of 2,8%, which reduces to 2,2% after dividend withholding tax.
The PEG ratio, based on estimated March 2018 earnings and assuming compound earnings growth of 8,5% over two years, is 3,15x. This is very expensive. If I work on ten-year mean PE ratio of 15x, then the PEG ratio would come down to a much more reasonable 1,76x.
It is interesting to compare Mr Price with Tencent, perceived to be “expensive”. The F2017 PE ratio is 53,7x based on my earnings estimate and at a share price of HK$463. In isolation that does seem pricey.
However, Tencent, which has a powerful, competitive, and growing product offering, is projected to grow earnings at a compound rate of 32% over three years. Earnings for the year to December 2017 are estimated to have grown by 43,6% and then projected to grow by 30% in F2018. The PEG ratio, off a 2017 base, is 1,66x, which is roughly half that of Mr Price.
Recommendation:
Together with a high PE ratio and PEG ratio there is a modest dividend yield so there is no compensation. On a DCF and share buyback valuation methodology I derive fair value of R160 per share, which also coincides with the ten-year mean forward PE ratio.
Mr Price is therefore a Trading Sell and a Portfolio Sell.
Mr Price share price in ZA rand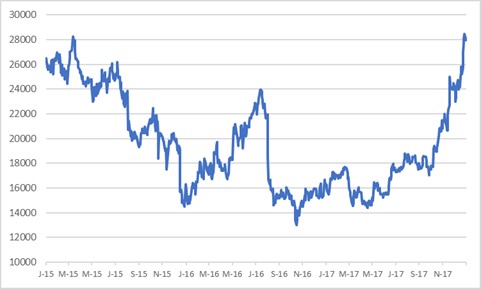
Wishing you profitable investing, until next time.
Mark N Inham