
Two new exchange-traded funds launched recently offer South African investors new ways to access global markets.
CoreShares, owned by investment groups Grindrod, RMI Investment Managers and Yellowwoods Capital, recently listed the CoreShares S&P 500 ETF and CoreShares S&P Global Property ETF. Both are interesting as they track indices not currently tracked by any ETF on the JSE and substantially expand the ways South Africans can gain exposure to international markets.
The S&P 500 is the oldest and one of the most recognised indices in the world. It provides broad exposure to the US and global economy, containing the biggest 500 companies listed on the New York Stock Exchange. An alternative is the MSCI USA, which is tracked by the Db x-tracker USA ETF and is slightly broader, holding 617 constituents.
Suitability
If you are looking to increase your global exposure, the CoreShares S&P 500 is worth considering. While it tracks companies listed in the US, the S&P 500 has very good exposure to the global economy. Given that all the underlying stocks are denominated in dollars, the ETF can be used to hedge against the prospect of a weakening rand.

What it does
The ETF tracks the price and yield performance of the S&P 500 index by holding a portfolio of securities in the same proportion as the basket of securities that make up the index. Because the index is weighted by market capitalisation, higher-value companies take up bigger weightings and lower-value companies take up smaller positions.
Advantages
Although invested offshore, this and other global ETFs are considered local assets, which means investing in them won’t affect your offshore asset allocation limit of R10m per year.
Disadvantages
A clear selling point is its currency-hedge attribute but the actual returns from underlying stocks are not that encouraging.
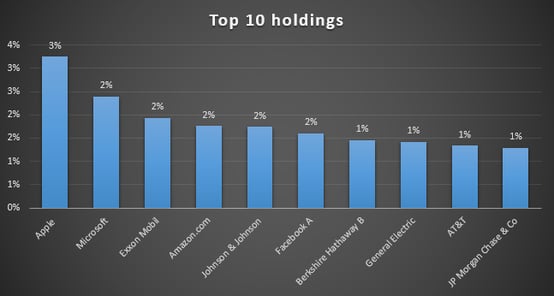
Top holdings
The S&P 500 is well diversified and is not overly concentrated on one stock. The top 10 holdings make up only 18% of the overall portfolio with the biggest asset, Apple, constituting 3.25%. In terms of sector weightings, information technology companies account for 21% of the fund.
Risk
This is a 100% investment in equities, which is a riskier asset class than bonds or cash, but the returns over time should compensate for volatility. An investment in this ETF should ideally form part of a more diversified portfolio.
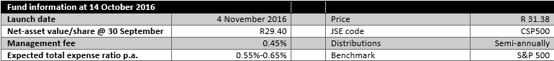
Fees
CoreShares is expected to have a total expense ratio (TER) of between 0.55% and 0.65%, which is far cheaper than the Db x-trackers whose average TER is 0.8%.
Historical performance
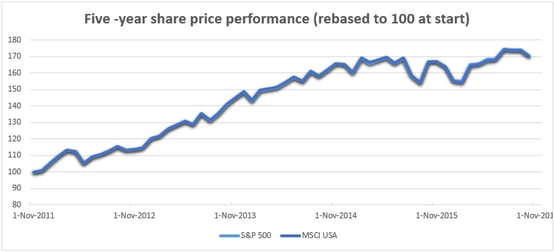
CoreShares S&P 500 doesn’t have any performance history yet. On the graph below, we show the five-year performance of its underlying index (S&P 500) against that of the MSCI USA which is tracked by the Db x-tracker USA. The performance of the two was largely the same. Both indices grew at an average of about 14.6% a year in dollar terms. This, however, exclude dividends and doesn’t account for the change in the exchange rate over that period. Considering that the rand has weakened against the dollar over the past five years, the actual growth in rands is likely to be well more than 14.6%.
Fundamental view
The S&P 500 generates about 56% of its earnings from the US. The balance is spread across Europe, Asia and the Americas with a bit from emerging markets.
Several factors are likely to influence the economic performance of the index but the surprise victory by Donald Trump has increased uncertainty over the US and global economic outlook. It is early days and will take some time before there is greater clarity on which of Trump’s campaign promises will result in actual policy change.
Concerns over Trump aside, the US economic outlook is healthy enough, with GDP expected to come in this year at 1.8%. The Eurozone and Japan are implementing stimulatory monetary policies which are also beneficial to equity markets. In the UK, the Bank of England Monetary Policy Committee (MPC) left the policy interest rate unchanged at 0.25% at its last meeting earlier this month but raised its GDP forecast for 2017 to 1.4% from 0.8% projected immediately after the Brexit referendum.
But for this ETF the rand exchange rate plays a big part in returns. For now, the market seems optimistic that the rand will maintain its strength, despite many of the negative underlying economic fundamentals. A strong rand will erode the performance of the ETF.

Alternatives
As an alternative to this ETF, you may consider the DBX USA, which has a similar underlying portfolio, or the DBX FTSE 100 and DBX Japan, which invest in the UK and Japan respectively.
About Exchange traded funds (ETFs)
Exchange Traded Funds (ETFs) are passively managed investment funds that track the performance of a basket of pre-determined assets (in this case, US-listed companies). They are traded the same way as shares and the main difference is that whereas one share gives exposure to one company, an ETF gives exposure to more than one company in a single transaction. ETFs can be traded through your broker the same way as shares, say, on the EasyEquities platform. In addition, it qualifies for the tax-free savings account, where both capital and income gains accumulate tax free.
Benefits of ETFs
- Gain instant exposure to various underlying shares in one transaction
- They diversify risk because a single ETF holds various shares
- They are cost-effective
- They are liquid – it is usually easy to find a buyer or seller and they trade just like shares
- High transparency through daily published index constituents
|