Intellidex Reviews March 2019: Other ETFs
Bonds and cash were star performers in 2018. This is because of their low-risk attributes: investors tend to gravitate to lower-risk asset classes in choppy markets. Despite performing badly during February, we think bonds will remain investors’ favourites in 2019.
The microeconomic view
Large caps advanced 3.78% thanks to resources and industrials, which covered up for the slack in financials. Small caps declined 2.41% while mid-caps gained 2.92%. The JSE resources index and the resources 10 index gained 7.84% and 6.7% respectively, driven by precious metals miners – Impala Platinum 55.27%), Lonmin (44.83%), Sibanye Gold (36.83%) and Anglo-American Platinum (23.05%) – which benefited from strong prices for precious metals and a weaker rand. The industrials 25 advanced 4.38% as heavyweights Richemont, BAT and AB INBEV grew 13.3%, 9.3% and 7.5% respectively.
After a strong January performance, financials came under pressure in February with the financial 15 index dropping 1.19%. Capitec, the sixth-largest constituent in this index, put in the best performance with an impressive 12.99% return. However larger constituents – First Rand (-6.47%), Sanlam (-5.28%), Absa (-.2.55%) – dragged the financials index down. On ETFs, the NewFunds S&P Givi SA Resources and the Satrix Resi led with gains of 9.83% and 8.44% respectively.
The “laggards” were Stanlib SA property and CoreShares Property Index Tracker SAPY, with losses of 3.45% and 3.51% respectively. Funds that track top 40 stocks closed out February with gains ranging between 1.35% (CoreShares Top 40 Equally Weighted ETF) and 6.54% (NewFunds Shariah Top 40). Bond funds were under pressure with those that track inflation-linked bonds ending in the red while the only fund that tracks vanilla bonds gained slightly.
ETFs featured
We have split the ETFs featured into three broad categories:
Bonds and Cash:
If you are investing for a very short period, usually less than a year, then the NewFunds TRACI 3 Month (up 0.53% during February) is a natural choice because it is least sensitive to sudden adverse interest rate movements. It is like earning interest on your cash at the bank with a minimal possibility of capital loss.
For a longer investment horizon, protecting your investment against inflation is paramount. We therefore maintain our choice of the Satrix ILBI ETF (down 0.52%), which has the lowest expense ratio in this category. Furthermore, nominal bonds add a unique risk-return dimension that differs from inflation-linked bonds and improves overall portfolio performance.
Furthermore, nominal bonds add a unique risk-return dimension that differs from inflation-linked bonds and improves overall portfolio performance. As with equities, investors also need to diversify their bond portfolios internationally. We think investors can choose between Stanlib Global Bond ETF or Ashburton World Government Bond ETF. They track investment-grade sovereign bonds mostly issued by the US, UK, Japan and selected European countries. However, the Stanlib Global Bond ETF has the lowest TER. Both are less than a year old.
Dividend:
If you rely on your investment income for day-to-day expenses you may want to allocate a portion of your portfolio to ETFs that have a high distribution ratio. Two funds come naturally to mind: the Satrix Dividend Plus and CoreShares S&P South Africa Dividend Aristocrats.
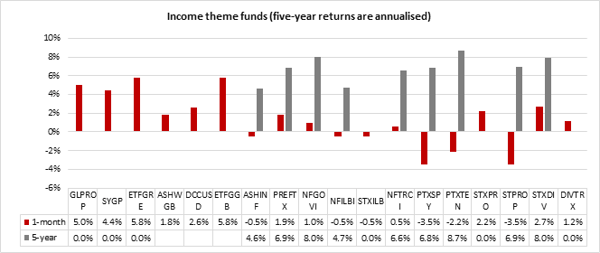
However, property funds tend to have even higher pay-out ratios. We maintain our choice of the Stanlib SA Property ETF (down -3.45%). The Stanlib fund boasts the lowest TER in the segment. For foreign property funds ETFs, the Sygnia Itrix Global Property ETF (up 5.78%) is the cheapest in this category.
Diversified funds:
If you find the process of diversifying your portfolio daunting, two ETFs can do it for you. They combine equities and bonds to produce a diversified portfolio for two investor archetypes, designed to meet two different risk appetites:
Mapps Protect is more conservative, usually suitable for older savers.
Mapps Growth suits investors with a long-term horizon.
They climbed 0.99% and 1.88% respectively in 2018.
There's plenty more from where that came from. The team at Intellidex have more insights for the month of March. To see more in-depth analysis and market insights (global and local), check out the full note here.
Background: Exchange-traded funds (ETFs)
Exchange-traded funds (ETFs) are passively managed investment funds that track the performance of a basket of pre-determined assets. They are traded the same way as shares and the main difference is that whereas one share gives exposure to one company, an ETF gives exposure to numerous companies in a single transaction. ETFs can be traded through your broker in the same way as shares, say, on the EasyEquities platform. In addition, they qualify for the tax-free savings account, where both capital and income gains accumulate tax free.
Benefits of ETFs
- Gain instant exposure to various underlying shares or bonds in one transaction
- They diversify risk because a single ETF holds various shares
- They are cost-effective
- They are liquid – it is usually easy to find a buyer or seller and they trade just like shares
- High transparency through daily published index constituents
If you thought this blog was interesting, you should also read:
Intellidex Reviews:
February 2019 Picks
Disclaimer
This research report was issued by Intellidex (Pty) Ltd. Intellidex aims to deliver impartial and objective assessments of securities, companies or other subjects. This document is issued for information purposes only and is not an offer to purchase or sell investments or related financial instruments. Individuals should undertake their own analysis and/or seek professional advice based on their specific needs before purchasing or selling investments. The information contained in this report is based on sources that Intellidex believes to be reliable, but Intellidex makes no representations or warranties regarding the completeness, accuracy or reliability of any information, facts, estimates, forecasts or opinions contained in this document. The information, opinions, estimates, assumptions, target prices and forecasts could change at any time without prior notice. Intellidex is under no obligation to inform any recipient of this document of any such changes. Intellidex, its directors, officers, staff, agents or associates shall have no liability for any loss or damage of any nature arising from the use of this document.
Remuneration
The opinions or recommendations contained in this report represent the true views of the analyst(s) responsible for preparing the report. The analyst’s remuneration is not affected by the opinions or recommendations contained in this report, although his/her remuneration may be affected by the overall quality of their research, feedback from clients and the financial performance of Intellidex (Pty) Ltd.
Intellidex staff may hold positions in financial instruments or derivatives thereof which are discussed in this document. Trades by staff are subject to Intellidex’s code of conduct which can be obtained by emailing mail@intellidex.coza.
Intellidex may also have, or be seeking to have, a consulting or other professional relationship with the companies mentioned in this report.
Subscribe To Our Research Portal
Search all research
Let Us Help You, Help Yourself
From how-to’s to whos-whos you’ll find a bunch of interesting and helpful stuff in our collection of videos. Our knowledge base is jam packed with answers to all the questions you can think of.
