Catch this insight by Intellidex on the South African equity market. This note is on the CoreShares Top 50 ETF. This ETF should be considered by investors that are looking for long-term exposure to large and medium-sized companies on the JSE.
Intellidex insight: The CoreShares Top 50 ETF is, in our view, one of the best funds for investors seeking broad exposure to South African general equities. The fund casts a relatively wide net across the SA equity market covering both large- and midcaps with a very reasonable total expense ratio of 0.2%.
Weightings are determined by market capitalisation with each constituent weighting capped at 10% of the fund – which differentiates it from most top 40 funds. Any excess holding over the 10% index cap is redistributed to other counters. This is good for diversification as it sidesteps the problem of portfolio concentration.
However, like other market capitalisation-based funds, the CoreShares Top 50 is prone to holding higher weightings of counters with high valuations and lower weightings of those with relatively low valuations. This is because if a stock or sector rallies or falls, it naturally becomes a larger or smaller portion of the index.
Fund description:The CoreShares Top 50 ETF tracks the S&P South Africa 50 Index, which is made up of the 50 largest companies on the JSE. Constituents are capped at 10% of the index on a quarterly basis.
Click logo to view
CoreShares Top 50 ETF
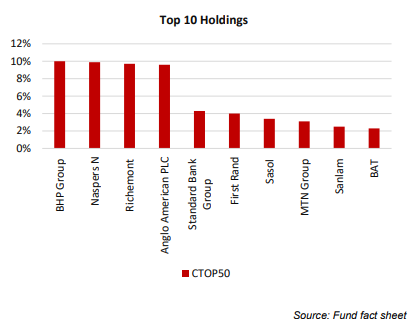
Top holdings: The top 10 constituents make up 55.7% of the fund. Notably, no single stock dominates the fund. Naspers, which would have an overbearing weight in an uncapped top 50 index, accounts for just 9.9% of the CoreShares fund. The ETF is also relatively well diversified across different sectors of the JSE.
Suitability:This fund suits long-term investors seeking exposure to large and medium-sized companies on the JSE. As an all equity investment it suits investors with an appetite for risk. Equity investments tend to exhibit higher short-term volatility than other asset classes, so a longer investment horizon gives a portfolio time for returns to accumulate ahead of volatility.
Historical performance:The CoreShares Top 50 ETF has underperformed the general market (represented by the all share index) over the past year but outperformed over three years. It returned 8% a year over the past three years against the all share index’s 7.64%. Notably, much of this growth came through during the past six months when the fund gained 11.89%.
The growth came mainly from its exposure to rand hedge stocks such as Naspers and Richemont, which have grown strongly over the past few years while the rand has weakened. So this gives the fund a double boost – many of the bigger listed companies operate in markets that are growing faster than SA’s while the rand weakness boosts their offshore earnings in rand terms.
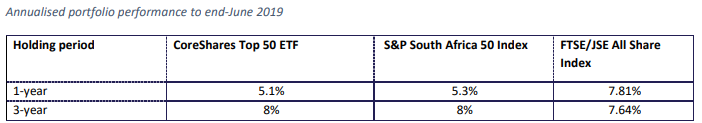
Source: http://www.etfsa.co.za/docs/perfsurvey/perform%20survey%20-%20June2019.pdf and June 2019 fact sheets
Fundamentals:: The top 50 companies on the JSE represent more than 90% of the overall market capitalisation and their performance is driven by general economic activity. SA’s economy is struggling. It contracted by 3.2% in the first quarter of the year but rebounded with growth of 0.9% in the second quarter. However, that was off a low base and Intellidex is forecasting GDP growth of only 0.6% this year. GDP growth is being hampered by numerous issues including load-shedding, distressed state-owned enterprises, weak demand, slow global growth and socio-political tensions.
Click logo to view
CoreShares Top 50 ETF
The Reserve Bank’s interest rate cut of 25 basis points in July of 25 failed to meaningfully boost consumer and business confidence, which points to a gloomy outlook for equities. However, as mentioned above, the significant foreign exposures of the companies held in the fund benefit from rand weakness and are often in regions where economic growth is faster than SA’s.
Internationally, geopolitical uncertainty including Brexit and the US-China trade war remains high. A positive aspect is that interest rates in most developed markets are being lowered.
Fund statistics:
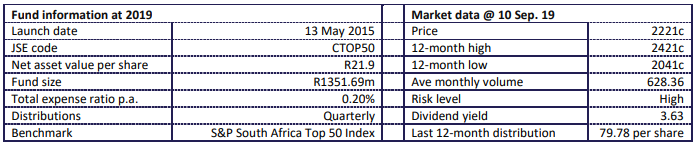
Source: INET and June 2019 fact sheets
Alternatives: The Absa NewFunds S&P GIVI SA Top 50 (total expense ratio: 0.36%) is an alternative to the CoreShares ETF. The difference lies in their methodology: CoreShares selects and weights constituents based on their market capitalisation while the Absa fund applies the fund manager’s estimate of intrinsic value.
Click below to view
CoreShares Top 50 ETF Fact Sheet

Background: Exchange-traded funds (ETFs)
Exchange-traded funds (ETFs) are passively managed investment funds that track the performance of a basket of pre-determined assets. They are traded the same way as shares and the main difference is that whereas one share gives exposure to one company, an ETF gives exposure to numerous companies in a single transaction. ETFs can be traded through your broker in the same way as shares, say, on the Easy Equities platform. In addition, they qualify for the tax-free savings account, where both capital and income gains accumulate tax free.
Benefits of ETFs
- Gain instant exposure to various underlying shares or bonds in one transaction
- They diversify risk because a single ETF holds various shares
- They are cost-effective
- They are liquid – it is usually easy to find a buyer or seller and they trade just like shares
- High transparency through daily published index constituents
|