Insight from Mark N Ingham
Recommendation summary
So here’s the question. What now with banks’ exposure following yet another rate rise, this time 50 basis points?
Firstly, micro differentiation on stocks makes even more sense. In a more settled situation there was little deviation between the main players – the proverbial rising tide carrying all boats.
Secondly, the so-called endowment effect that benefits income as rates rise is temporary and superseded by the negative implications of reduced borrowing affordability. Nedbank already has a negative net interest margin impact of 0,21% during the rate hiking period.
Thirdly, as I have pointed out previously, this rising rate cycle is atypical and poses heightened risk to banks if there is continued tightening. This latest 50 basis point increase in the repo rate to 6,75%, with effect from 29 January, occurs against an even weaker economic and employment backdrop than previous moves up.
Banks
Not so equal
FirstRand ranks first by rating and ability to withstand a deteriorating credit environment, followed by Nedbank, Standard Bank and Barclays Group Africa
Earlier analysis dated 11 November 2015 and 20 November 2015 (see “Increase in interest rates, good or bad for banks…?” and “Repo nudges north again”) unpacked the context to the prevailing business cycle and rising interest rates.
Interest rates are 175 basis points higher than in January 2014.
On 31 January 2014, the prime lending rate went from 8,5% to 9% and this latest rise takes prime to 10,25%.
The previous move up was on 20 November 2015, four months after a 25 basis point increase.
The 50 basis point rise this time owes much to the detrimental consequences of the Finance Minister musical chairs over the 9-13 December 2015 period.
The big fright from the evening of 9 December seems to be the wakeup that is long overdue, at least insofar as political policy direction goes. A broad church of revulsion at the President’s imperilling of the country balance sheet has set the scene for some interesting political developments.
According to the South African Reserve Bank, the ratio of debt to disposable income increased to over 78% in Q3 2015 in line with the increase in prime in July 2015.
The cost of servicing household debt as a ratio of disposable income increased to 9,6% - the highest ratio since Q3 2010 and comparing with around 8,5% in mid-2013. The ratio will likely climb to 10% - the ten year average.
Bad debt charges will be higher than earlier anticipated and therefore strong portfolio provisions are necessary.
As we have had a 50 basis point rise already this year the probability of rates being at least 100 basis points higher in 2016 have risen. Forward rate agreements have been pricing in at least 100 to 125 basis points extra compared with a couple of months back.
Whilst bank stocks have rallied in recent days one needs to build in ratings fat for what could be a choppy few months.
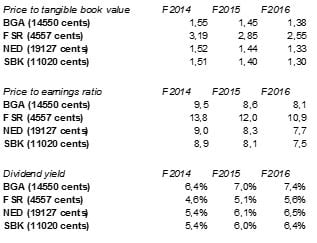
Banks are relatively cheap (as the table below indicates) but that does not necessarily mean they are a great buy.
Ratings
A positive is that bond yields have eased of late. Some degree of confidence has returned as the government dials in damage limitation.
But much water has yet to flow, not least the upcoming budget and signals of a proper return to fiscal discipline in the form of real spending cuts and hard policy decisions taken.
Whereas the 2026 R186 spiked by over 200 basis points on 10 and 11 December 2015 compared with late November, that has since eased to less than 70 basis points with the R186 closing last Friday at 9,16%.
The yield on ten-year government bonds increased by 150 basis points from the end of January 2015 to a level of 8,5% on 30 November 2015. In this period, the ten year US government bond yield increased by 56 basis points. Meantime, the currency risk premium on SA government bonds widened by almost 90 basis points. Since November, the yield has increased by around 220 basis points compared with January 2015.
To put this 220 basis point yield increase in context for valuation purposes, the present value of cash flows decreases by 24%. All things being equal, the price of an interest rate sensitive stock should be roughly 25% lower today than in one year ago.
Indeed, that is what has happened to three of the big four. Standard Bank stock is 28% lower,
Nedbank stock is 25% lower and Barclays Africa is down 23%.
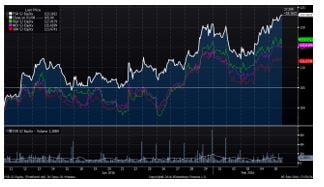
The exception is FirstRand as the stock is down only 12% over a year whilst the premium rating relative to the three peers (as measured by PE ratio and yield) has strengthened.
Over the past month, FirstRand stock too has outperformed relative to peers, being the only stock to actually rise in price.
From a pairs trading strategy point of view, FSR remains the one to be long on.
FSR outperforming peers – share prices over one month based to 100
The big four have fallen from a price/tangible book value of 2,5x a year ago to about 1,7x book on average.
Credit growth is unlikely to be higher than 7% in South Africa, which is in line with nominal GDP growth. Similarly, non-interest revenue is likely to mirror that.
The Africa picture is also less attractive with Standard Bank and Barclays Africa having the highest exposure.
The endowment effect on capital and funding is marginally positive as assets reprice to a slightly higher degree than liabilities. But the margin increment, allowing for a higher forward interest rate now, is roughly 20 basis points across the big four and could be lower due to hedging by the banks.
Bad debt charges lag the ups and downs in prime and debt service ratio by twelve months and so the real impacts will be felt from the first quarter of 2016 onwards.
Nedbank’s net interest margin has already been under pressure with the endowment benefit negated by other factors. The net interest margin of 3,36% as at June 2015 was below the 3,57% before the rate hiking cycle.
Whilst there are differences in the earnings composition of the big four it is small and each slice and dice their segments differently. Even these buckets are not mutually exclusive and all face similar macroeconomic and interest cycle sensitivities. Nedbank has the smallest retail exposure whilst FNB retail is the largest contributor to FirstRand.
Earnings composition
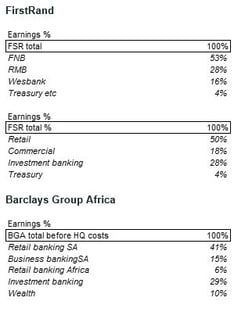
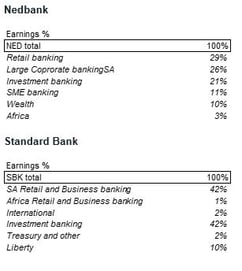
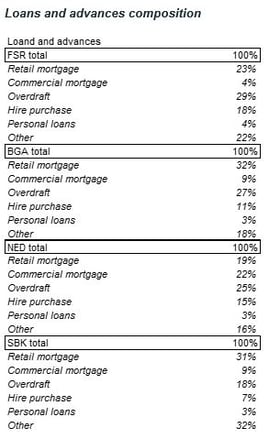
However, capital management and risk metrics vary considerably between the big four.
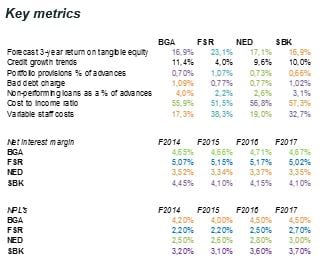
I have ranked the big four in order of preference:
FirstRand
Maintained top pick with a fair value of R44 and a target price of R51.
Best in sector performing loans coverage of over 100% - well above the bad debt charge of 0,77%, also best in sector. Portfolio provision coverage for the other three is around 60%.
Whilst there has been a big improvement, particularly at Barclays Africa which was in the region of 20% in 2010, none come close to FirstRand.
Whilst commercial loans growth relative to retail loans growth may account for some of this discrepancy – commercial should have lower credit loss risk – the flipside is that commercial loans are less profitable. FNB has had higher retail loans growth but has provided well against that.
FirstRand has had good impetus from vehicle finance and unsecured lending. These have higher bad debts but have higher margins – as seen relative to peers. The hire purchase and micro loan markets have been deteriorating for some months and so the bad debt ratio should rise too. Portfolio provisions protect against a fallout.
Best in sector return on equity at FirstRand is achieved without higher gearing or release of portfolio provisions.
FirstRand trades at a premium in the banking sector for good reason – it is better positioned to withstand shocks and a deteriorating credit market whilst the cost structure is significantly more flexible.
Nedbank
Nedbank is ranked second, largely on mix of business, but the rating is high enough and I see few catalysts to drive it higher.
The rating has been improving along with improved return on equity and stronger balance sheet.
Non-interest revenue has been growing ahead of rivals with transaction fee income up about 80% in five years.
Fair value at R180 with target price R193.
Standard Bank
Ranking third, Standard has some potential for catch up as its rating is the lowest by a small margin. The wasted energy on trying to become a global emerging market operator has been costly and has not helped confidence. From enjoying a premium price to book relative to peers a few years back Standard now trades at a discount.
Standard also likes to spend on corporate real estate and is not shy on information technology either. Customers probably won’t notice much tangible benefit from either. IT spend is well above peers with software amortisation costs alone as much as the other three together and detracting from returns.
I have fair value at R105 with a target of R114.
Barclays Group Africa
Continuing to rank least preferred, Barclays Group Africa is at an interesting cross roads. Whatever influence Barclays has had it is largely at the corporate bank whilst dividends flow north given the 62,3% holding. Based on my estimate R8,5 billion in dividends will flow out for F2015 of which R5,3 billion goes to Barclays.
Exec sentiment is not especially good whilst internal speculation abounds on what Barclays has planned, if anything. There is talk about possibly hiving off parts of the group as a way to realise some value.
I’d caution against a typical bid premium in the stock as a trading strategy, if anything we may have a discount. From a trading point of view I consider it business as usual until we have something concrete.
Mortgage lending has been declining from over 55% of its loans a few years back to about 40%. This is still a good provider of net interest income and related fees and insurance. Market share in mortgages has fallen to 23% from 30% in five years whilst hire purchase market share has fallen to 18% from 22%, overdraft market share has stayed flat at 20% with personal loans market share halving to 8%.
BGA derived 20% of revenue from Africa outside South Africa in F2014 and 15% of headline earnings. In the first half of F2015 the proportion of headline earnings is 18%. But in conventional retail banking the proportion of earnings is only 6% of the group. There is a long hill to climb.
Market share has been eroded in the SA retail bank and given the competitive position of rivals and Capitec that is not going to reverse.
Fair value at R130 with the target price R139.
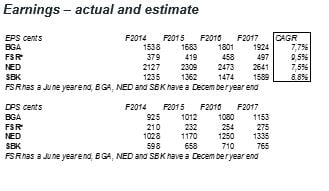
Mark N Ingham
Ingham Analytics Ltd
08 February
Subscribe To Our Research Portal
Search all research
Let Us Help You, Help Yourself
From how-to’s to whos-whos you’ll find a bunch of interesting and helpful stuff in our collection of videos. Our knowledge base is jam packed with answers to all the questions you can think of.
