Intellidex Reviews: Satrix DIVI
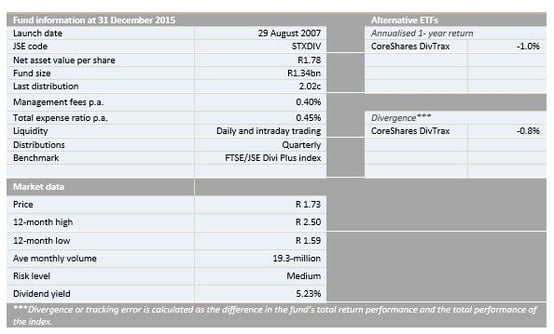
Suitability: This ETF is invested in shares that pay high dividends. It is therefore ideal for investors willing to tolerate the higher risk implied by equities but also interested in a flow of income that comes from dividends. The ETF is based on an index of high dividend paying stocks. These tend to be larger, mature companies that pay out cash rather than reinvesting it for growth. Such companies typically fall into the “value” classification, with low price: earnings ratios and high book value relative to market value. With a dividend yield of 5.23% it is likely to be the highest dividend-paying ETF available.
What it does: The Satrix DIVI ETF tracks the price and income performance of the FTSE/JSE Dividend Plus index. All the dividends received from companies in the index are paid to investors on a quarterly basis net of costs. In order to reduce costs and minimise tracking error, the Satrix Divi fund engages in scrip lending activities with Investec and Sanlam and manufactured dividends that arise are passed on to the fund investors. If you hold the ETF as part of a tax-free savings account with a stockbroker, the dividends will accumulate within the tax-free shelter, but if it is held directly the dividends will be paid in cash to investors outside of the tax-free wrapper.
The index is made up of the 30 largest listed companies included in the FTSE/JSE top 40 or FTSE/JSE mid-cap indices (excluding property companies), weighted by the one-year forecast dividend yield of companies meeting certain minimum liquidity requirements. The forecast dividend yield is based on consensus forecasts provided by investment analysts to Inet BFA.
The fund is rebalanced quarterly in line with the FTSE/JSE index rebalancing methodology.
Advantages
- The fund focuses on income-generating stocks providing income for investors
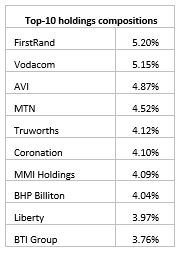
- The fund has low concentration risk, with the biggest asset representing only 5.2% of the fund
- In the long run it theoretically outperforms other major asset classes such as bonds and cash
Disadvantages
- The fund constitutes mostly mature companies with limited growth prospects
- The disbursal of dividends is a problem for long-term investors looking for capital growth as the cash has to be reinvested
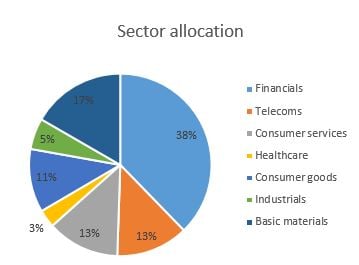
Top holdings: The top 10 holdings constitute 43.8% of the overall portfolio with financials taking the lion’s share of 38%. The biggest stock, FirstRand, makes up only 5.2% of the fund which diminishes concentration risk.

Risk: Controversy rages in investment theory about value stocks. Naysayers argue that the value they represent is because of their low growth expectation and possible future distress. On the other hand, prominent value investors like Warren Buffett argue that low valuations present significant upside potential. In the case of the Satrix Divi the total return (which captures both income and capital movements) has lagged the inflation rate on both 3- and 5-year annualised return periods but has beaten it since inception.
This is a 100% investment in equities, a riskier asset class than bonds or cash, but over time a relatively higher return should compensate for volatility.

Fees
The total expense ratio is 0.45%. The costs consist primarily of management fees and additional expenses such as trading fees and other operating expenses.
Historical performance
The performance of an investment in the Satrix DIVI ETF depends on the method used to invest. A lump-sum investment will mimic the ETF performance. However, investing through regular instalments will see the performance lag the ETF, according to historical evidence, and the pattern is apparent in other ETFs too. The performance described in the table below is for a lump-sum investment.
The fund returned an annualised negative 3-year return of 2.7% compared with annualised inflation rate of 5.3% during the same period (and the five-year period annualised inflation rate was 6.6%). So it has performed poorly as an inflation hedge.

Fundamental view
The fund holds a diverse range of good quality companies. A high dividend yield is usually an indicator of confidence in the future of a company, as management is willing to disburse cash rather than hold on to it as a safety net for possible risks. It also usually indicates a company with strong financial management that is able to generate and look after its cash position. These factors make high dividend stocks popular not just for their income characteristics but also as a general indicator of company quality. The fact that the DIVI ETF weights companies based on analysts’ forecasts helps with the risk of picking only yesterday’s winners, which is a problem with historic yields.
Investors, though, need to think about how to manage the income that the ETF will generate. If it is held within a tax-free stockbroking account, rather than directly with Satrix, the income can be accumulated and then reinvested within the tax shell. If held directly, cash will flow out of the tax-shell and reinvestment will count as part of the R30,000/year investment limit.
The ETF is a good long term investment for those who can tolerate the volatility of equity investments.
Alternatives
A close peer is the CoreShares S&P South Africa Dividend Aristocrats fund which is also constructed based on dividends that a company pays. It has a relatively high dividend of 4.02%. Its tracks an index, S&P South Africa Dividend Aristocrats Index, which measures the performance of JSE stocks that follow a policy of increasing or maintaining stable dividends for five consecutive years. This is a young fund and has returned an annualised return of -1% since its launch in April 2014.

Disclaimer
This research report was issued by Intellidex (Pty) Ltd. Intellidex aims to deliver impartial and objective assessments of securities, companies or other subjects. This document is issued for information purposes only and is not an offer to purchase or sell investments or related financial instruments. Individuals should undertake their own analysis and/or seek professional advice based on their specific needs before purchasing or selling investments. The information contained in this report is based on sources that Intellidex believes to be reliable, but Intellidex makes no representations or warranties regarding the completeness, accuracy or reliability of any information, facts, estimates, forecasts or opinions contained in this document. The information, opinions, estimates, assumptions, target prices and forecasts could change at any time without prior notice. Intellidex is under no obligation to inform any recipient of this document of any such changes. Intellidex, its directors, officers, staff, agents or associates shall have no liability for any loss or damage of any nature arising from the use of this document.
Remuneration
The opinions or recommendations contained in this report represent the true views of the analyst(s) responsible for preparing the report. The analyst’s remuneration is not affected by the opinions or recommendations contained in this report, although his/her remuneration may be affected by the overall quality of their research, feedback from clients and the financial performance of Intellidex (Pty) Ltd.
Intellidex staff may hold positions in financial instruments or derivatives thereof which are discussed in this document. Trades by staff are subject to Intellidex’s code of conduct which can be obtained by emailing mail@intellidex.coza.
Intellidex may also have, or be seeking to have, a consulting or other professional relationship with the companies mentioned in this report.
Subscribe To Our Research Portal
Search all research
Let Us Help You, Help Yourself
From how-to’s to whos-whos you’ll find a bunch of interesting and helpful stuff in our collection of videos. Our knowledge base is jam packed with answers to all the questions you can think of.