Intellidex Reviews: db x-trackers Euro Stoxx 50 Index ETF (Now Sygnia)

Suitability: This fund is ideal for long-term investors concerned about rand weakness and the performance of the South African economy.
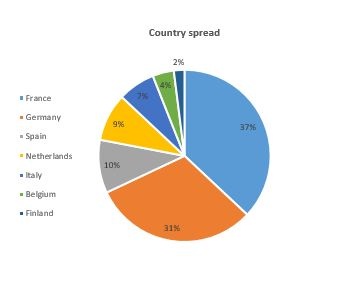
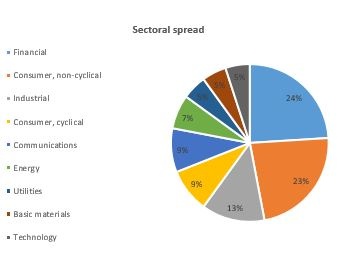
The portfolio offers exposure to blue chip European companies.
Investing in this ETF does not affect any exchange control limits as it is rand-settled. Allocating a portion of investment assets offshore helps achieve diversification and lowers any portfolio’s overall risk profile.
What it does: The ETF tracks the price and yield performance of the DJ Euro Stoxx 50 index by holding a portfolio of securities in the same proportion as the basket of securities that make up the index. The ETF pays dividends bi-annually in June and December. If you hold the ETF as part of a tax-free savings account with a stockbroker, the dividends will accumulate within the tax-free shelter, but if it is held directly, the dividends will be paid in cash to investors outside of the tax-free wrapper. Investors are encouraged to re-invest dividends so as to closely mimic the total performance of the index.
The DJ Euro Stoxx 50 index is weighted by market capitalisation, adjusted by free float, of the 50 largest and most liquid blue-chip stocks from countries within the eurozone. It excludes locked-in shares such as those held by promoters, company founders and governments. That means the weightings of each investment of the ETF are in proportion to the value of available shares for that company. The index is reviewed annually in September for rebalancing and reconstitution.
Advantages: In the past five years at least 80% of the fund’s returns were due to foreign currency gains on the back of the rand’s weakness. The ETF offers easy access to companies on various eurozone stock exchanges through one investment at a low cost without any exchange control complications. Most companies on the index are multinationals with business interests spanning various continents, generating earnings in multiple currencies.
Disadvantages: A clear selling point is its currency-hedge property but the eurozone is suffering low economic growth, with a demand-side problem because a sizeable chunk of the population is ageing. And its expansionary monetary policies have as yet failed to meet targeted growth indicators.
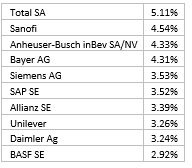
Top holdings: The top-10 holdings constitute 38.15% of the overall portfolio with the biggest asset, oil group Total SA, constituting 5.11%. That reflects a reasonable level of diversification with no single asset having a disproportionate influence on the portfolio. This is a problem with ETFs that track JSE’s top 40 index. Most of the top holdings are multinational companies with significant market power and are strong cash generators.

Risk: This is a 100% investment in equities, which is a riskier asset class than bonds or cash but the returns over time should compensate for volatility. An investment in this ETF should therefore form part of a more diversified portfolio. While there are other risks related to politics, regulations and liquidity, these are diminished because the companies generate revenue from a diverse range of countries.

Fees
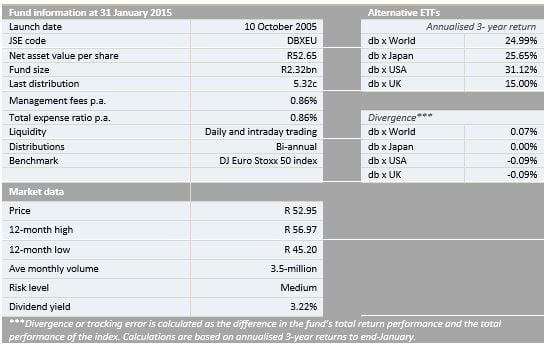
The total expense ratio is 0.86%.
Historical performance
Investors should note that the performance of an investment in the db x Euro ETF depends on the method used to invest. A lump-sum investment will closely replicate the ETF performance. However, investing through regular instalments will see the performance lag the ETF, according to historical evidence, and the pattern is apparent in other ETFs too. This reinforces the importance of a long investment horizon. The performance described in the table below is for a lump-sum investment.

Its has a three-year annualised return of 23.18% and a tracking error of 0.04%.
Fundamental view
Returns from this fund have been driven primarily by rand weakness and eurozone economic activity. The recent weakness of the rand looks set to continue, perhaps even drifting weaker.
The eurozone is still recovering but at a slower pace than the global economy, which is estimated to have grown by 3% in 2015. According to the EU Winter Forecast 2016 paper, eurozone growth will remain modest this year, accelerating slightly to 1.7% from 1.6% in 2015, supported by a number of positive factors such as low oil prices, the euro’s exchange rate and accommodative policies. The ECB’s quantitative easing programme is expected to accelerate growth as it did in the US, but it is being hampered by the legacy of 2008 financial crisis, excessive debt and the slowdown in emerging economies. The recent depreciation of the euro against the US dollar should help eurozone exporters.

Alternatives
Because there are no other JSE-listed ETFs which track the DJ Euro Stoxx 50, the closest alternatives would be ETFs that track stocks listed on various developed markets. There are a number of developed markets index trackers, all offered by Deutsche Asset Management.
The db x tracker World fund, which tracks the MSCI world index, with the objective of mimicking the equity performance of 23 developed markets, is its closest peer, as some of the asset holdings are similar.
The db x tracker USA tracks the US MSCI index of around 600 major US listed securities.
Other trackers are db x Japan, which Japan’s top 400 companies, and db x UK, which tracks the 100 largest UK securities.
All the alternatives have a similar fee structure of about 0.86%.

Disclaimer
This research report was issued by Intellidex (Pty) Ltd. Intellidex aims to deliver impartial and objective assessments of securities, companies or other subjects. This document is issued for information purposes only and is not an offer to purchase or sell investments or related financial instruments. Individuals should undertake their own analysis and/or seek professional advice based on their specific needs before purchasing or selling investments. The information contained in this report is based on sources that Intellidex believes to be reliable, but Intellidex makes no representations or warranties regarding the completeness, accuracy or reliability of any information, facts, estimates, forecasts or opinions contained in this document. The information, opinions, estimates, assumptions, target prices and forecasts could change at any time without prior notice. Intellidex is under no obligation to inform any recipient of this document of any such changes. Intellidex, its directors, officers, staff, agents or associates shall have no liability for any loss or damage of any nature arising from the use of this document.
Remuneration
The opinions or recommendations contained in this report represent the true views of the analyst(s) responsible for preparing the report. The analyst’s remuneration is not affected by the opinions or recommendations contained in this report, although his/her remuneration may be affected by the overall quality of their research, feedback from clients and the financial performance of Intellidex (Pty) Ltd.
Intellidex staff may hold positions in financial instruments or derivatives thereof which are discussed in this document. Trades by staff are subject to Intellidex’s code of conduct which can be obtained by emailing mail@intellidex.coza.
Intellidex may also have, or be seeking to have, a consulting or other professional relationship with the companies mentioned in this report.
Subscribe To Our Research Portal
Search all research
Let Us Help You, Help Yourself
From how-to’s to whos-whos you’ll find a bunch of interesting and helpful stuff in our collection of videos. Our knowledge base is jam packed with answers to all the questions you can think of.