What was noteworthy about the 2017 annual result was a return to a “progressive” dividend policy, the sort of policy that hit a buffer once earnings stalled and the expensive Nigerian regulatory problem occurred, along with naira currency woes. Between 2012 and 2016, the normalised EBITDA margin fell, gearing increased, and dividends paid increased ahead of earnings. In 2015, the rate of dividend increases slowed sharply and in 2016 the total dividend was cut by 610 cents to 700 cents, the same dividend that was declared for 2017. A new base of 500 cents is signalled for 2018 but the rate of growth thereafter is 10% to 20% per annum, a heroic rate of increase relative to where earnings are likely to be. Investors should be cautious of companies that promise to pay increased dividends year after year. Vodacom has a dividend policy of 90% of Group earnings, together with a contribution via Safaricom, which is sensible as your dividend is a function of how the business performs. MTN remains a Sell relative to Vodacom.
“Progressive Dividend Hard to Justify”
MTN [JSE:MTN]
Share price: R131,50
Net shares in issue: 1,798 billion
Market cap: R236,4 billion
Forward PE F2018: 26,1x
Forward PE F2019: 21,9x
Forward dividend yield 2018: 3,8%
Forward dividend yield 2019: 4,2%
Fair value per DCF: R120,00; Target price: R110,00
Trading Sell and Portfolio Sell
What you need to know:
The results for the year ended December 2017 are encouraging in the context of issues MTN has had to face in the previous two years. But that is not saying much.
There are various ways to get to earnings per share.
Basic headline EPS is 182 cents compared to a loss of 77 cents. In 2016, the Nigerian regulatory fine was net 455 cents with a further 45 cents related to the interest unwind.
MTN prefers to highlight their adjusted EPS of 665 cents in 2017, which requires backing out an interest unwind of 46 cents, hyperinflation effects, forex gains and losses, MTN Zakhele, and loss on derecognition of a loan.
However, operational EPS is arguably closer to 506 cents per share, which is down by 7,6% and half what they made in 2012.
Whilst EBITDA is reflected as R47,0 billion by MTN, up 2,5%, this also includes a once-off profit of R6,0 billion on exercising the right to exchange the group’s interest in Nigeria Tower for a higher shareholding in IHS. This means that underlying operational EBITDA is R41,0 billion, which compares with R65 billion in 2014. Impairments of R3,0 billion were taken in Syria and Sudan.

The EBITDA margin overall is not improving and unlikely to, with an estimated 34% margin over the next three years.
In 2012, MTN had a net cash position whereas in 2017 this was a debt to equity ratio of 68% with 90% of debt reflected under head office. Total gross debt is R79,7 billion and net debt R57,1 billion. Of the head office borrowings of R59,2 billion, 55% or R32,5 billion is in US dollars.
A substantial amount continues to be allocated to capital expenditure with almost R35 billion spent in 2017.
The actual cash result versus the earnings result is important, let alone adjustments to flatter reported earnings, particularly in the context of claims on cash flow and now dividends.
MTN indicates it is effectively returning to the “progressive” dividend policy that it used to have, and which got it in to a whole heap of trouble when the earnings lagged the growth in dividend.

The abbreviated statement is: “The board anticipates declaring a total dividend of 500 cents per share for 2018, growing at 10% to 20% over the medium term. This will allow us to ensure that the dividend is funded from operational cash flows over the medium term”.
As an analyst, I struggle with this policy.
- it does not square with earnings after tax, from which dividends are usually declared and paid based on affordability;
- the dividend payout ratio on EPS will be higher than 100% for the fourth year in a row in 2018;
- their accounting puts dividends in to operating cash flow but there are other claims on cash flow too and they don’t provide enough detail on what true operating cash flow is – and if cash can flow from Nigeria unimpeded, for example;
- the Iran loan receivable is not taken in to the dividend equation, but Iran dividends are included;
- the planned Towers listing in New York, in which has a 29% interest, should have no part in future dividend.
As recently as 2013, the dividend cover ratio on earnings was 1,36x – in other words, MTN paid 73,5% of earnings in dividends. In 2014, this decreased to 1,23x cover, a payout ratio of 81%. By 2015, the cover ratio was 0,57x or put another way the company paid out 175,6% of earnings as a dividend.
If I take my operational EPS of 506 cents per share, then with a 700 cents dividend MTN has a negative cover ratio of 0,72 or a payout ratio of 138%.
In 2018, the dividend drops to 500 cents from 700 cents. This is a new base. It then grows at a heroic 10% to 20% “over the medium term” – which I interpret as five years.
At 10% growth, the dividend, off a 2018 base of 500 cents, is 805 cents after five years and at 20% growth it is 1244 cents after five years.
At 10%, that is 60% up on a base that is 29% smaller than in 2017. However, in 2023 your dividend is still less than the 824 cents in 2012, so eleven years of no growth if you had held the stock. Even at 20% the dividend would be the same in 2023 as the 12445 cents in 2014. It is a bit like going forward to the past.

The cash dividend goes from R13 billion in 2017 to R9,5 billion in 2018 and then to R15,0 billion in five years at 10% growth or R23 billion at 20% growth. To put R23 billion in context, that is 56% of operational EBITDA in 2017, and that is before MTN have paid interest and tax of about R10 billion and capex of, say, R30 billion.
MTN defines adjusted free cash flow as EBITDA less capex but ignores interest and tax and working capital. This inflates cash flow. The net cash from operating activities MTN reports includes dividends paid – Sasol, for example, would exclude that and have cash available from operating activities before then taking off dividends.
In 2017, EBITDA was R47,0 billion, including the once-off tower profit. From that you deduct cash interest of R3,9 billon, cash tax of R7,6 billion, and then capex and investing of R27,6 billion. That leaves R7,9 billion. Dividends paid were R13 billion, leaving a gap of R5,2 billion. Unsurprisingly, net debt increased by R5,2 billion, confirming my suspicion they are funding dividends from borrowings.
If there is modest growth in operating profit, then this progressive growth in dividends is going to result in the debt at best staying where it is but more likely growing. I have debt to equity of over 70% for the next few years.
Even if I am generous, adjusted EPS is estimated to be around 600 cents by 2019 versus the operational EPS of 506 cents in 2017. In 2019, dividend growth of 10% from 500 cents to 550 cents means that earnings are barely covering the dividend. If the dividend grows at 20% to 600 cents, then earnings just match the dividend.
If earnings remain stagnant, a not unlikely prospect given the economics of fixed line and mobile telephony, then with a 20% growth in dividends MTN will be paying out twice its EPS in five years. Even at 10% a third more is forked out in dividends relative to earnings.
Recommendation:
I struggle to justify much more than R120 for the stock at a cost of capital of 13%. My target price is R110.
At the current share price of R131,50, the forward gross yield is 3,8% or 3,0% net of dividend withholding tax. This is a thin yield for minimal, if any, earnings growth in an industry in which you run to stand still.
Combined with a thin yield, the policy of hiking the dividend without reference to earnings is even less justification to want to own the stock. If MTN are trying to instil investor confidence by upping the dividend from a new base in 2018 this is an odd way to go about it.
I don’t like this dividend policy, preferring the far more sensible Vodacom approach. I thus remain sceptical on the MTN investment case.
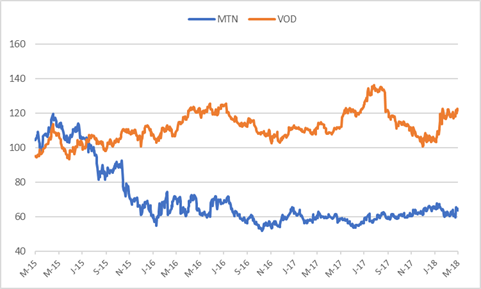
In my note on Vodacom dated 5 February 2018 (“Holding the line”) I observed that “This is therefore not a growth stock but, whilst running to effectively stand still, Vodacom is doing the right things to remain competitive in a price-down telecommunications environment”. Whilst I am not a big fan of the telcos, if you want to be exposed then Vodacom remains my better bet as it has fewer risk factors than MTN. On a trading theme I’d be short MTN relative to VOD.
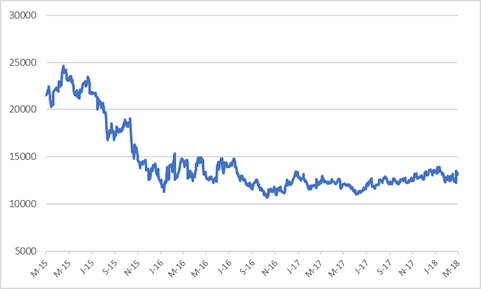
MTN share price in ZA rand
MTN and Vodacom based to 100 over three years
Wishing you profitable investing, until next time.
M N INGHAM