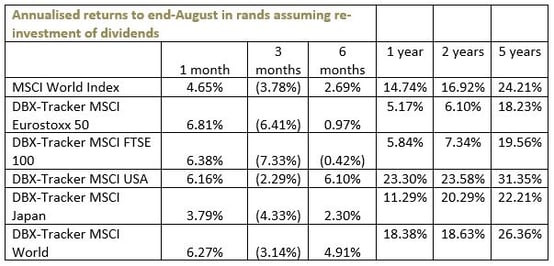
Performance review: The past 12 months haven’t been rosy for the db X-tracker MSCI World Index ETF (db X-World) and other international index tracker funds. While these funds often derive much of their growth from a weakening rand, the local currency strengthened against major currencies over the period. Due to the vagaries of currency movements, db X-World’s return for the 12 months to 3 October plunged to 7% compared with 18.38% for the 12 months to end-of August (shown on the table below).
But despite the pressure, db X-World remains one of the best-performing index tracking products on the JSE if analysed over a longer period. Over the past five years it had an annualised return of 21.45%, second only to the db X-USA which returned 26.20%. This is largely because the rand has weakened over that period – five years ago it was around R8/dollar. Below are the annualised returns of the international ETFs to end-August.
Outlook: About 60% of this ETF is invested in US companies, 23% in European companies and 9% in Japanese companies. While not robust, the US economic outlook is fairly healthy, with GDP expected to come in this year at 1.8%. The Eurozone and Japan are implementing stimulatory monetary policies which are also beneficial to equity markets.
That outlook, however, is not that important when analysing this ETF: it’s the rand that matters the most. Over the past five years, more than two thirds of the total fund returns have been due to foreign exchange gains. The rand has seen marked strength against major currencies in the second half of the year as a US interest rate hike failed to materialise. Whether that remains the case in the medium to long term will depend on a number of variables including the overall performance of the US economy, domestic politics, developments around the fiscus and SA’s credit ratings.
For now, the market seems optimistic that the rand will maintain its strength, despite many of SA’s underlying economic fundamentals being largely negative. The latest vehicle sales data reflected a sharp contraction of 14.3% year on year in September, against market expectations of a contraction of 10%. Vehicle sales are sensitive to the credit cycle and the data point to a more pronounced slowdown in retail sales generally.
However, the prospects of a recession seem to have receded. Statistics SA figures show that SA’s economy rebounded in the second quarter to post growth of 3.3% quarter-on-quarter growth, and Finance Minister Pravin Gordhan has expressed confidence that the annual GDP growth rate will be above zero. There was also talk recently that the NPA is backing away from charging Gordhan over the alleged “rogue unit” set up while he ran the SA Revenue Service, implying that there may be some political stability returning to National Treasury, which is also positive for the rand.
All these factors, could, however, be overridden if SA’s credit rating is downgraded or if the US raises its base interest rate.
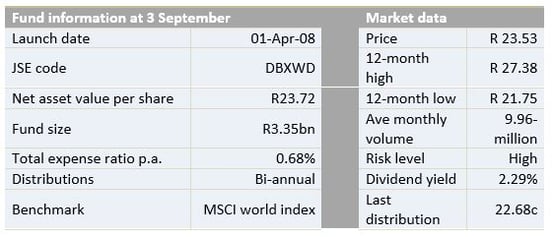
Suitability: The db X-tracker MSCI World Index ETF is an ideal choice for young investors and others with a long-term investment horizon who can tolerate volatility in short-term returns. It’s one of the cheapest rand hedges on the market.
What it does: The ETF tracks the price and yield performance of the MSCI world index by holding a portfolio of securities in the same proportion as the basket of securities that make up the index. Essentially, an investment in this ETF tracks the developed world’s equity markets.
Advantages: The ETF offers easy access to companies on various developed world stock exchanges through one investment at a low cost. Many of these companies are multinationals with business interests spanning various continents, generating earnings in multiple currencies. In addition, the South African economy has been struggling and this fund brings exposure to economies with better prospects.
Disadvantages: The ETF has a disproportionate exposure to the US market, with 60% invested in US-based companies. Therefore, US macroeconomic developments have a pronounced effect on the fund’s performance. However, it is well diversified at individual asset holdings level, with its biggest investment in Apple constituting only 2.1% of the fund, which somewhat mitigates the risk. Another disadvantage is that many developed world economies, particularly in Europe and Japan, are locked in low-growth mode.
Top holdings: The top-10 holdings constitute just less than 10% of the overall portfolio, reflecting the high level of diversification. Apart from Apple, notable holdings are Microsoft, Exxon Mobil, General Electric, Johnson & Johnson, Wells Fargo, Amazon, Nestle, JPMorgan Chase and Alphabet (Google’s holding company). All these companies are global leaders in their respective industries with long track records. They have significant monopoly power and are highly profitable cash generators.
Risk: This is a 100% investment in equities, which is a riskier asset class than bonds or cash. It is likely to be volatile, but the returns over time should compensate for volatility. We think the sectoral, geographical and currency diversity of the constituent companies diminishes the risks to a degree.
Fees
Fees take a total of 0.68% out of fund’s returns each year, a comparatively low cost. For every R1 000 invested, R6.84c goes to fees. This ETF is the cheapest in its category.
Alternatives
Because there are no other ETFs listed on the JSE that track the MSCI world index, the closest alternatives are ETFs that track stocks listed on various developed markets. There are a number of developed markets index trackers.
Db X-tracker USA tracks the US MSCI index of around 600 major US listed securities. We found that returns between db X-World and db X-USA were highly correlated over the past five years. Although db X-World’s performance was slightly inferior, it has the lowest fee structure. The high correlation can be explained by the fact that db X-World holds 59% of US stocks.
Db X-tracker Euro tracks the EuroStoxx 50 index, one of the most widely known European blue chip indices. The index contains the 50 most liquid blue chip stocks from countries within the Eurozone. This ETF has interesting prospects with the European Central Bank’s quantitative easing programme under way.
Other trackers are db X-Japan and db X-UK. The former tracks the MSCI Japan index of 400 major Japanese companies, while the latter tracks the FTSE 100 index of the 100 largest UK securities. However, these two are not highly correlated with db X-World because they are more limited geographically and in asset holdings.
All the alternatives have a similar fee structure of about 0.86%.
BACKGROUND: Exchange-traded funds (ETFs)
Exchange-traded funds (ETFs) are passively managed investment funds that track the performance of a basket of pre-determined assets. They are traded the same way as shares and the main difference is that whereas one share gives exposure to one company, an ETF gives exposure to numerous companies in a single transaction. ETFs can be traded through your broker in the same way as shares, say, on the EasyEquities platform. In addition, they qualify for the tax-free savings account, where both capital and income gains accumulate tax free.
Benefits of ETFs
- Gain instant exposure to various underlying shares in one transaction
- They diversify risk because a single ETF holds various shares
- They are cost-effective
- They are liquid – it is usually easy to find a buyer or seller and they trade just like shares
- High transparency through daily published index constituents

Disclaimer
This research report was issued by Intellidex (Pty) Ltd. Intellidex aims to deliver impartial and objective assessments of securities, companies or other subjects. This document is issued for information purposes only and is not an offer to purchase or sell investments or related financial instruments. Individuals should undertake their own analysis and/or seek professional advice based on their specific needs before purchasing or selling investments. The information contained in this report is based on sources that Intellidex believes to be reliable, but Intellidex makes no representations or warranties regarding the completeness, accuracy or reliability of any information, facts, estimates, forecasts or opinions contained in this document. The information, opinions, estimates, assumptions, target prices and forecasts could change at any time without prior notice. Intellidex is under no obligation to inform any recipient of this document of any such changes. Intellidex, its directors, officers, staff, agents or associates shall have no liability for any loss or damage of any nature arising from the use of this document.